It has been two months since the Bitcoin Cash hardfork which resulted in Bitcoin SV breaking off from the fourth-most prominent cryptocurrency. Since its introductions, Bitcoin SV has been in decline, mirroring the rest of the market bearing the repercussions of the November hardfork.
Buoyed by the collective market increase, Bitcoin SV is trading in green, which looks to be short-lived given the market movement. Bit-Z holds the maximum trading volume of Bitcoin SV amounting to $9.69 million or 12.5 percent in the BCHSV/BTC trading pair. The world’s largest crypto exchange Binance comes in second with a 12.09 percent or $9.37 million trading volume of Bitcoin SV in the BCHSV/USDT pair.
1-hour
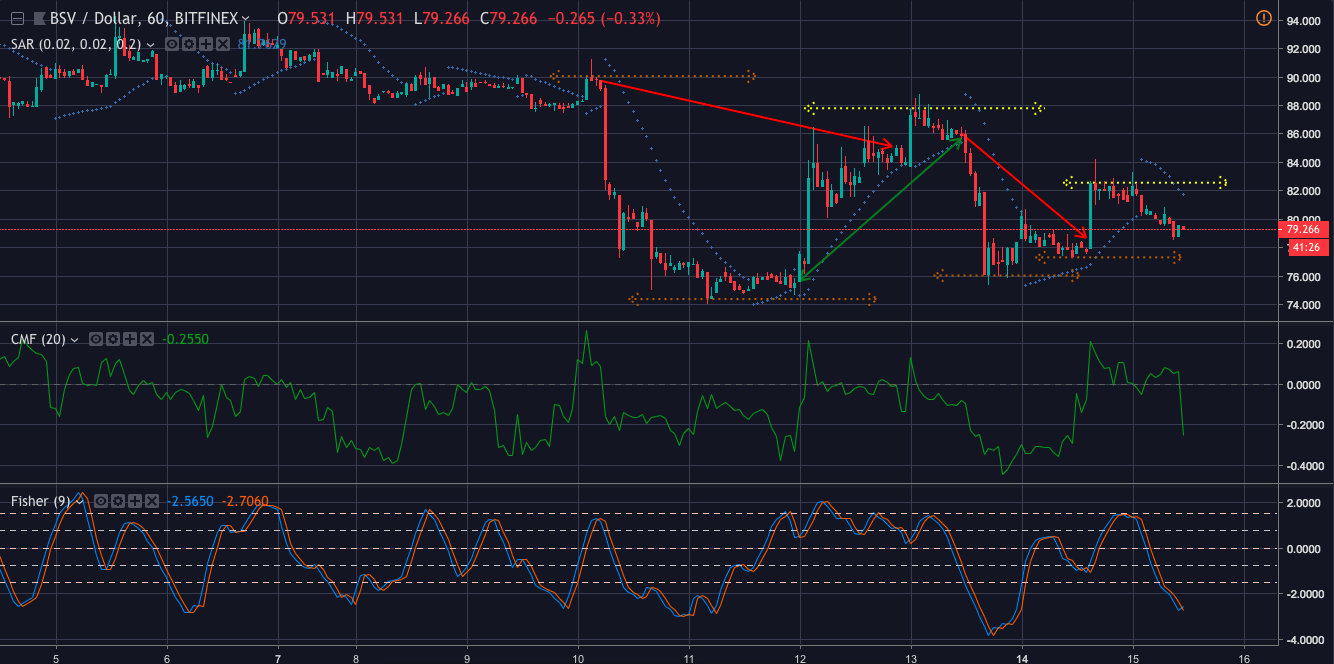
Bitcoin SV began the month in a relatively stable motion which halted on January 10, prior to the price decline. This decline began a series of price fluctuations. The coin experienced two downtrends respectively, the first of which began on January 10, and extended from $89.74 to $85.13, followed by a decline from $86.05 to $78.71. Between the two, an uptrend which extended from $75.68 to $85.66 was also experienced.
The immediate resistance level of the coin is $82.57, with a prior recorded resistance level placed at $87.77. The key support level was recorded last at $77.31 followed by at $76.06 and at $74.4.
The Parabolic SAR shows that Bitcoin SV is entering into a bearish swing as the dotted line is placed above the candlestick.
The Chaikin Money Flow indicates that investors are rapidly pulling their money out of Bitcoin SV with a steep decline in the CMF line.
The Fisher Transform indicator shows that the 2100 UTC on 14 January, the bearish line overtook the bullish line as the trend began to turn.
1-day
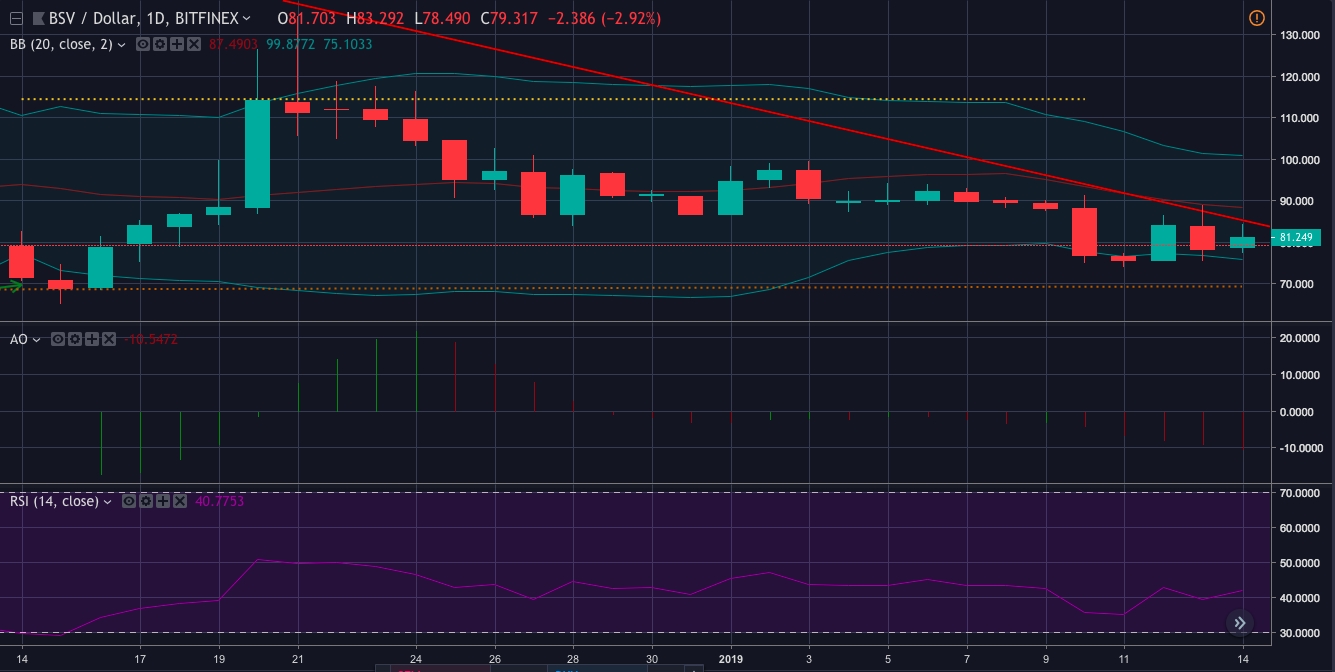
Despite its infancy in the market, Bitcoin SV has managed to reach the top-5 and even overtake Bitcoin Cash at one point, but BSV is now pegged at the 10th spot on the coin ladder while the prices continue to remain volatile. Given its short life-span, the coin has seen a downtrend since its initiation extending from $219.33 to $83.16 with a mild uptrend beginning on 23 November extending from $43.29 to $68.63.
The immediate key support level of the coin is placed at $69.38 with an earlier one placed at $43.29. The key resistance level of the coin is $114.09.
The Bollinger Band indicates that the volatility of the coin is beginning to decline as the mount begins to narrow in.
The Awesome Oscillator shows a red turn since the beginning of the year, with a mild indication of green lines, hence, pointing to a bearish market.
The Relative Strength Index points at a declining market sentiment, with investors increasingly selling off held Bitcoin SV. At press time, the RSI stands at 40.76, closing in on the oversold level.
Conclusion
Bitcoin SV may have started off on a high following the Bitcoin Cash hardfork, but given the recent trends the coin looks to be heading for a bearish swing, with all indicators pointing to a declining future for the coin.