- Fantom Coin is trading below a downsloping trendline on the daily chart.
- With sideways momentum, the market cap has remained below $1 billion over the past 10 days.
- Stoch RSI is moving towards an oversold zone with a lower-high formation against the daily chart.
Over the last few days, Fantom Coin has continued an intense sideways trend below $0.40. FTM recently broke out of the falling parallel channel, yet the market sentiment imprisoned purchasers despite the breakout.
Fantom price broke the symmetrical triangular pattern after breaching the parallel range, and the trader was liquidated owing to a lack of confirmation of the directional trend. Conversely, the bears continued to dominate the FTM price below the descending trend line.
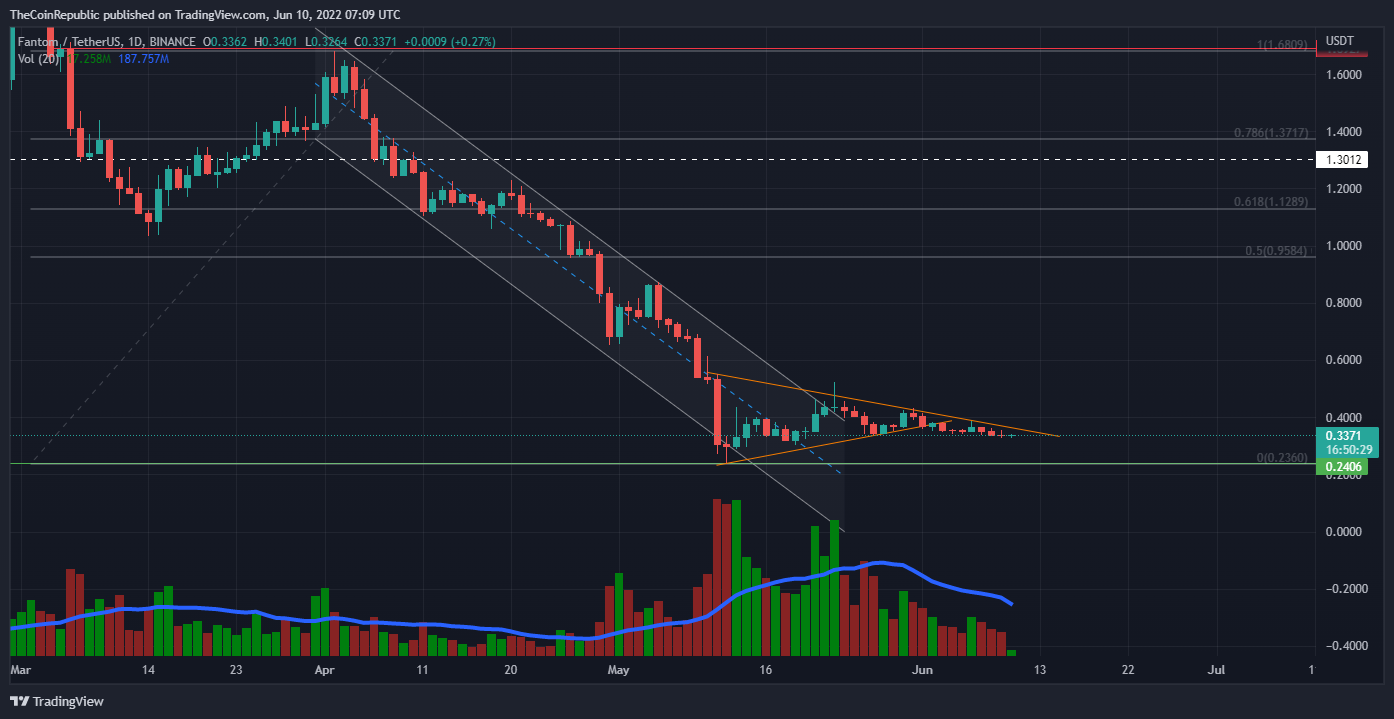
The bears focused on the 6-month low of 0.2396 points during the downtrend with the Doji candle on May 12. But buyers are stuck on this signal so buyers struggle to ease the pressure of the spell.
At the time of writing, FTM coin is trading at the $0.006 mark with a decline of 1.4% in the last 24 hours. Despite the bearish trend, the bulls have an important hedge area near the $0.24 mark or there could be a more fearful situation if the price drops below this level.
Daily trading volume continues to decline and shows extremely low liquidations. So the price is not fluctuating much as compared to last month. Similarly, the market cap has remained below $1 billion over the past 10 days.
Vital technical indicator are showing bearish trend for FTM
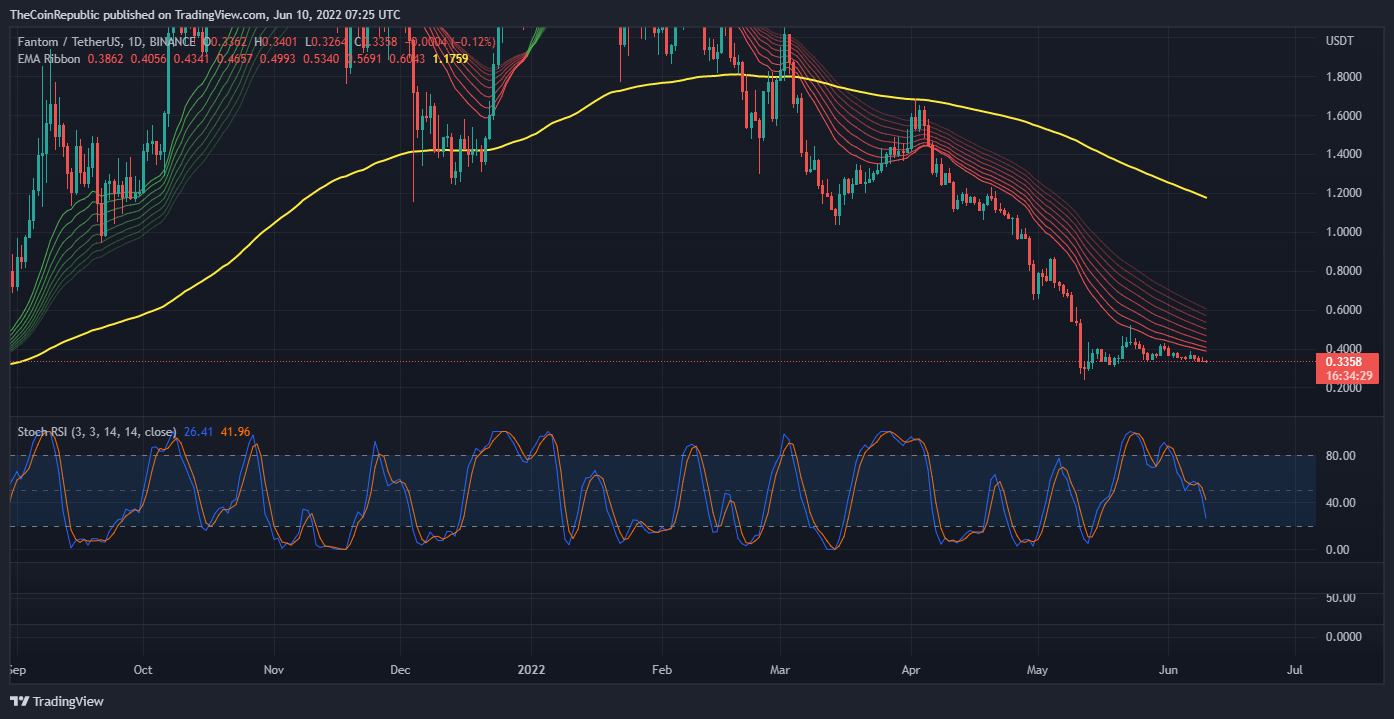
The 200 EMA line (yellow) has a red zone of long volatility. Daily price action remains below the EMA Ribbon indicator on the daily price chart. Moreover, the Stoch RSI is moving towards an oversold zone with a lower-high formation against the daily chart.
Conclusion
Vital technical indicators are showing a sell signal for Fantom price. But while buyers are still expecting a trend reversal momentum, an even more dire situation could arise if the price breaks below the 6-month low.
Technical Levels
Resistance level- $0.50 and $1.0
Support level- $0.24 and $0.30
Disclaimer
The views and opinions stated by the author, or any people named in this article, are for informational ideas only and do not establish the financial, investment, or other advice. Investing in or trading crypto assets comes with a risk of financial loss.