XRP has had a very active week in the cryptocurrency space, with Ripple’s product announcing the commencement of multiple partnerships as well as giving an overall outlook of the past year.
The beginning of twenty nineteen has seen the second-largest cryptocurrency enjoy bullish highs as well as succumb to the pressure of the bear. This attribute has also been shared by several of the top honchos on the cryptocurrency charts, including Bitcoin [BTC] and Ethereum [ETH].
1-hour
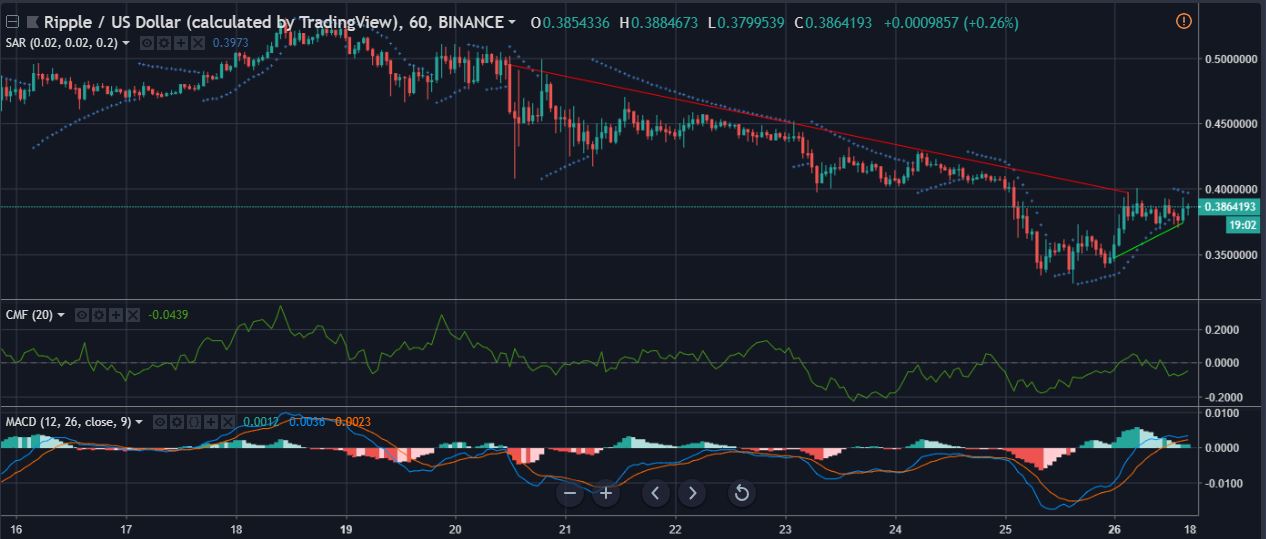
The one-hour chart for XRP shows a cryptocurrency trying to recover from the bearish trudge and continuing a sideways price movement. The cryptocurrency immediate support has fallen to $0.32, while the immediate resistance is holding at $0.388. The recent downtrend brought XRP’s price down from $0.386 to $0.33.
The Chaikin Money Flow indicator is at its lowest point in ten days. The hold below the zero-line indicates that the capital leaving the market is more than the capital coming into the market.
The Relative Strength Index has spiked towards the overbought zone after crashing below the oversold zone. The rally up is proof that the buying pressure is more than the selling pressure in the market right now.
1-day
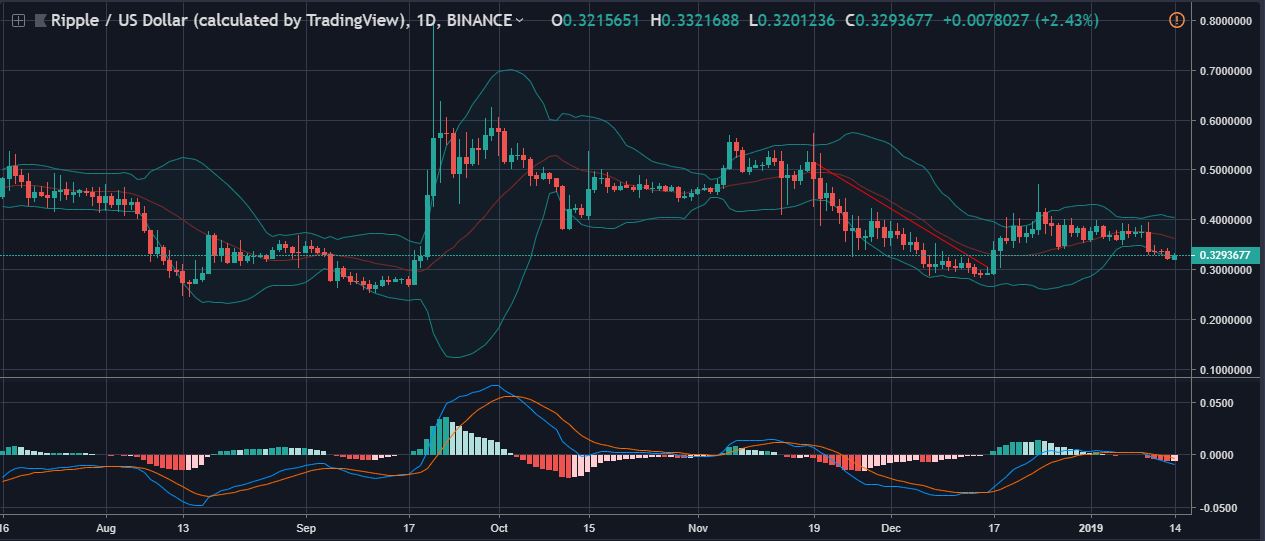
XRP’s one-day chart is indicative of the cryptocurrency succumbing to the pressure of the bear. The presence of the downtrend has affected the price of the cryptocurrency, at the same time protecting its long-term support. The long-term support is at $0.264, while the downtrend’s range is between $0.515 and $0.301.
The Bollinger band shows a slight divergence between the upper band and the lower band, an indication of an immediate price breakout and trend change. As of now, the cryptocurrency has come under attack by the bear as shown by the price candles falling below the lower band.
The MACD indicator clearly displays the sideways trend of the cryptocurrency. The MACD line and the signal line have both taken a downward turn moving as a conjoined pair. The MACD histogram is a sporadic mic of bearish and bullish signals.
Conclusion
The cryptocurrency market’s bearish trend looks likely to continue as shown by the above-mentioned indicators. XRP’s performance has been hampered by the intervention of the bull but fans of the cryptocurrency can draw some solace from the fact that Bitcoin [BTC], the world’s largest cryptocurrency has suffered bigger losses.