Waves (WAVES) increased by 190% over May 30 – June 1, but has been gradually retracing since.
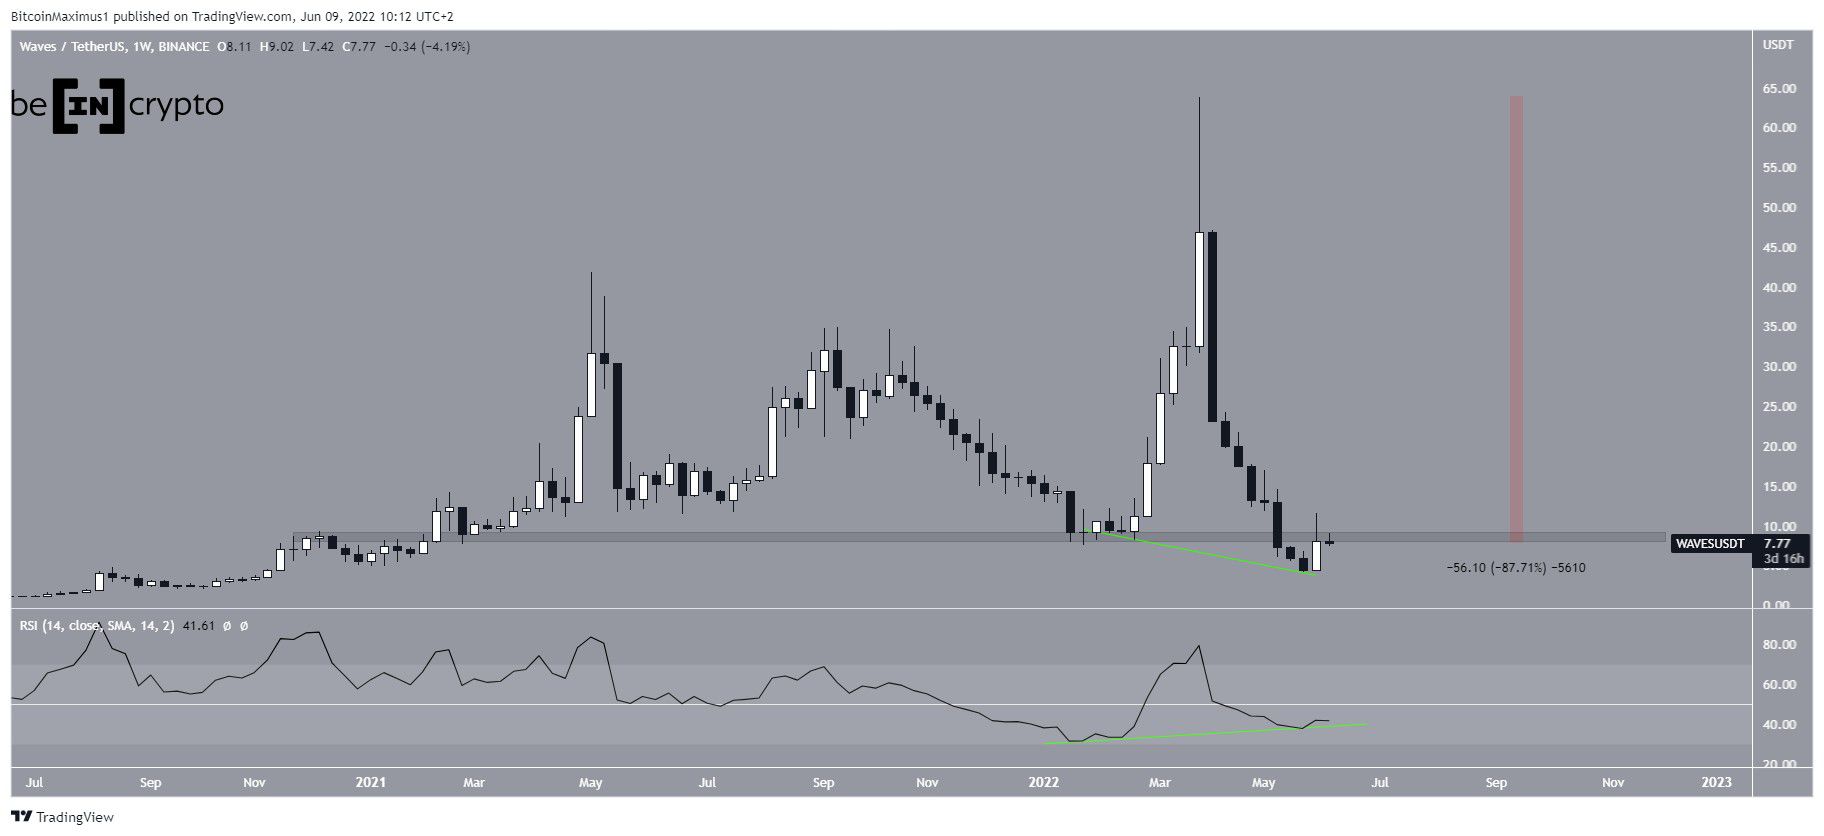
WAVES has been falling since reaching an all-time high price of $63.88 on March 31. The downward movement led to a low of $4.13 on May 29. This amounted to a drop of 88% measuring from the all-time high.
The price has bounced since, leading to a high of $11.60 on June 1.
However, the ensuing rejection and long upper wick served to validate the $8.60 area as support. This is a crucial horizontal level since it has intermittently acted as both resistance and support since December 2020.
Despite this bearish sign, the weekly RSI has been generating bullish divergence since the beginning of the year (green line)
So, while the price action is still bearish, the weekly RSI reading suggests that a bullish trend reversal could be close.
Ongoing bounce
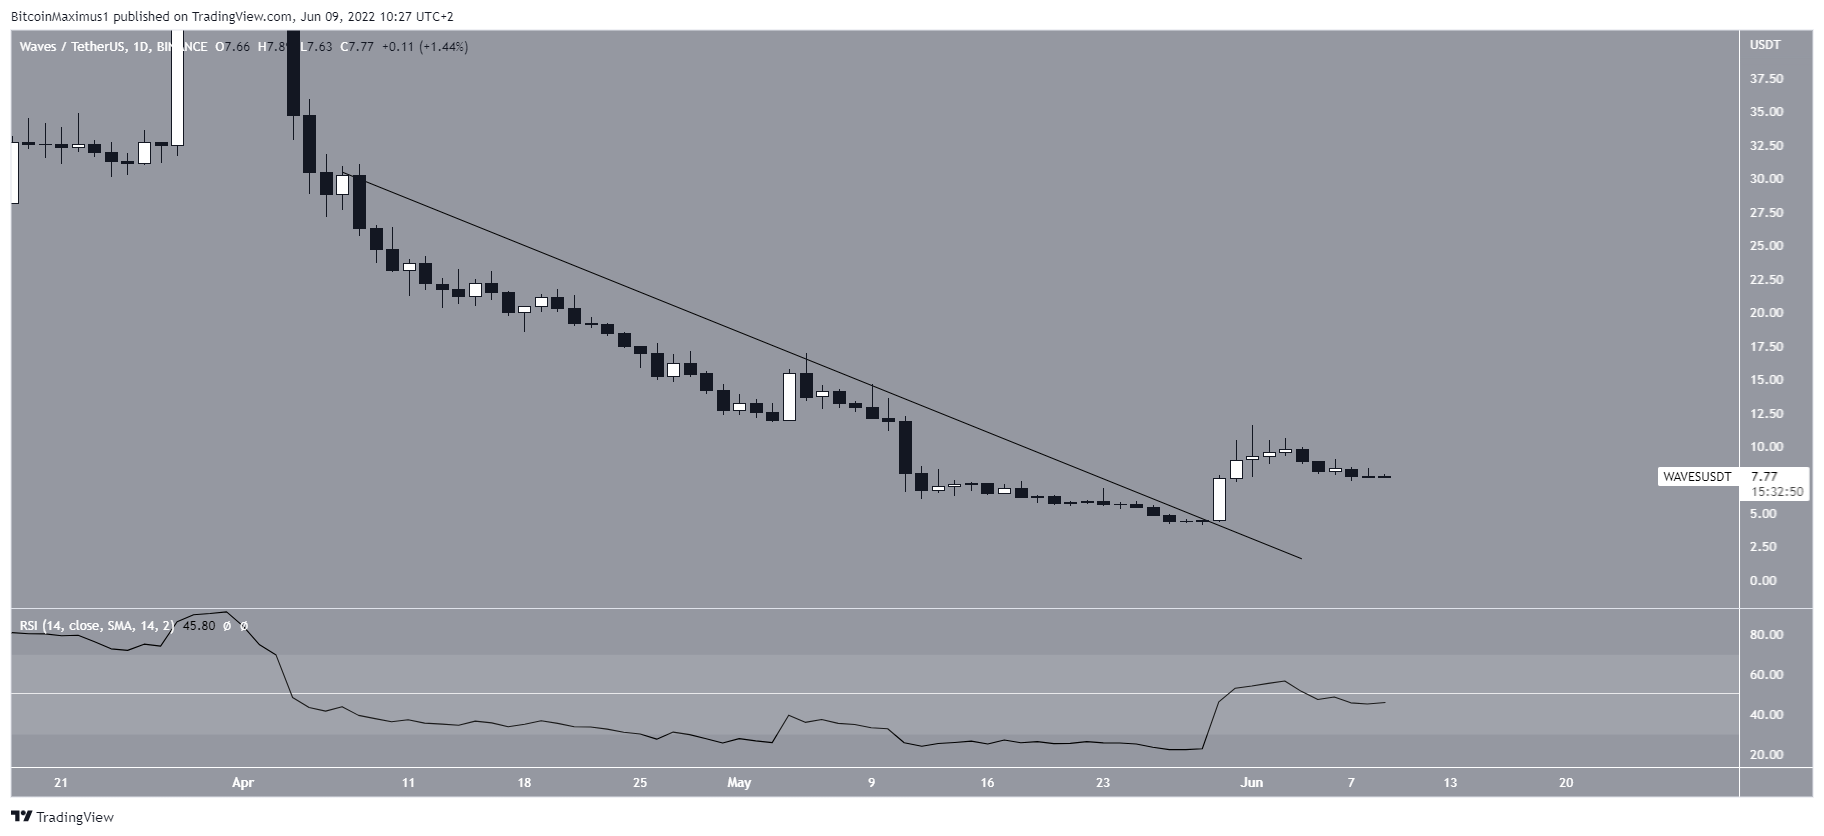
The daily chart shows that WAVES broke out from a descending resistance line on May 30, leading to the current upward movement.
While the breakout also caused a sharp RSI increase, the indicator has now fallen below 50, a level which is considered a threshold for a bullish/bearish trend.
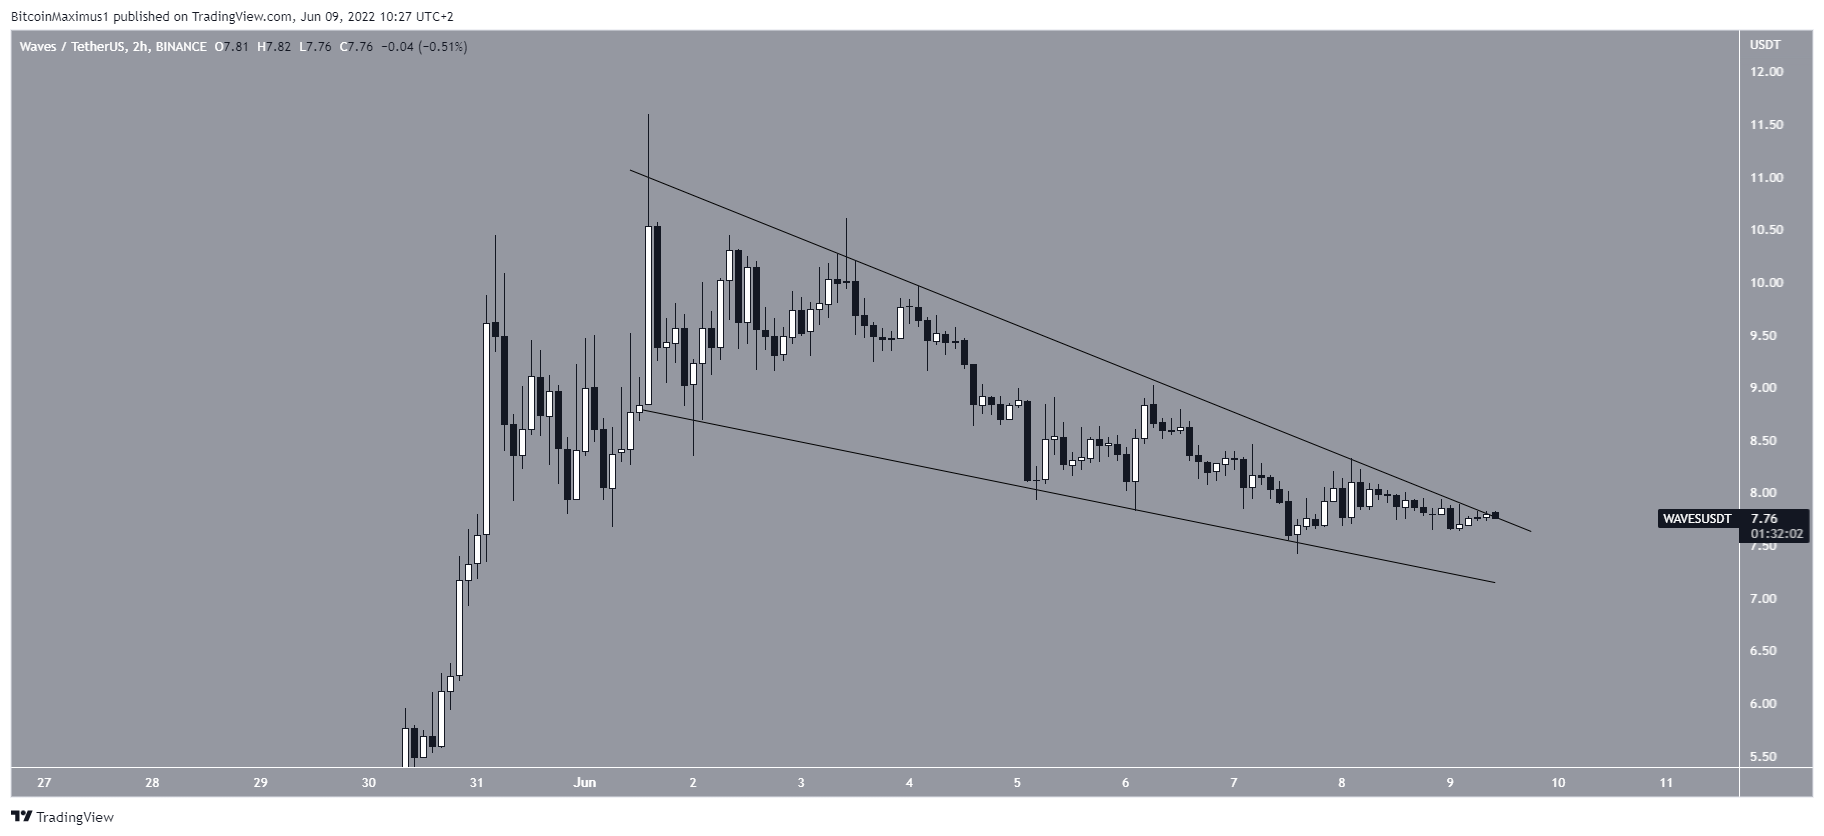
However, the two-hour chart shows that the price is trading inside a descending wedge. This is considered a bullish pattern, meaning that an eventual breakout from it would be expected.
Wave count analysis
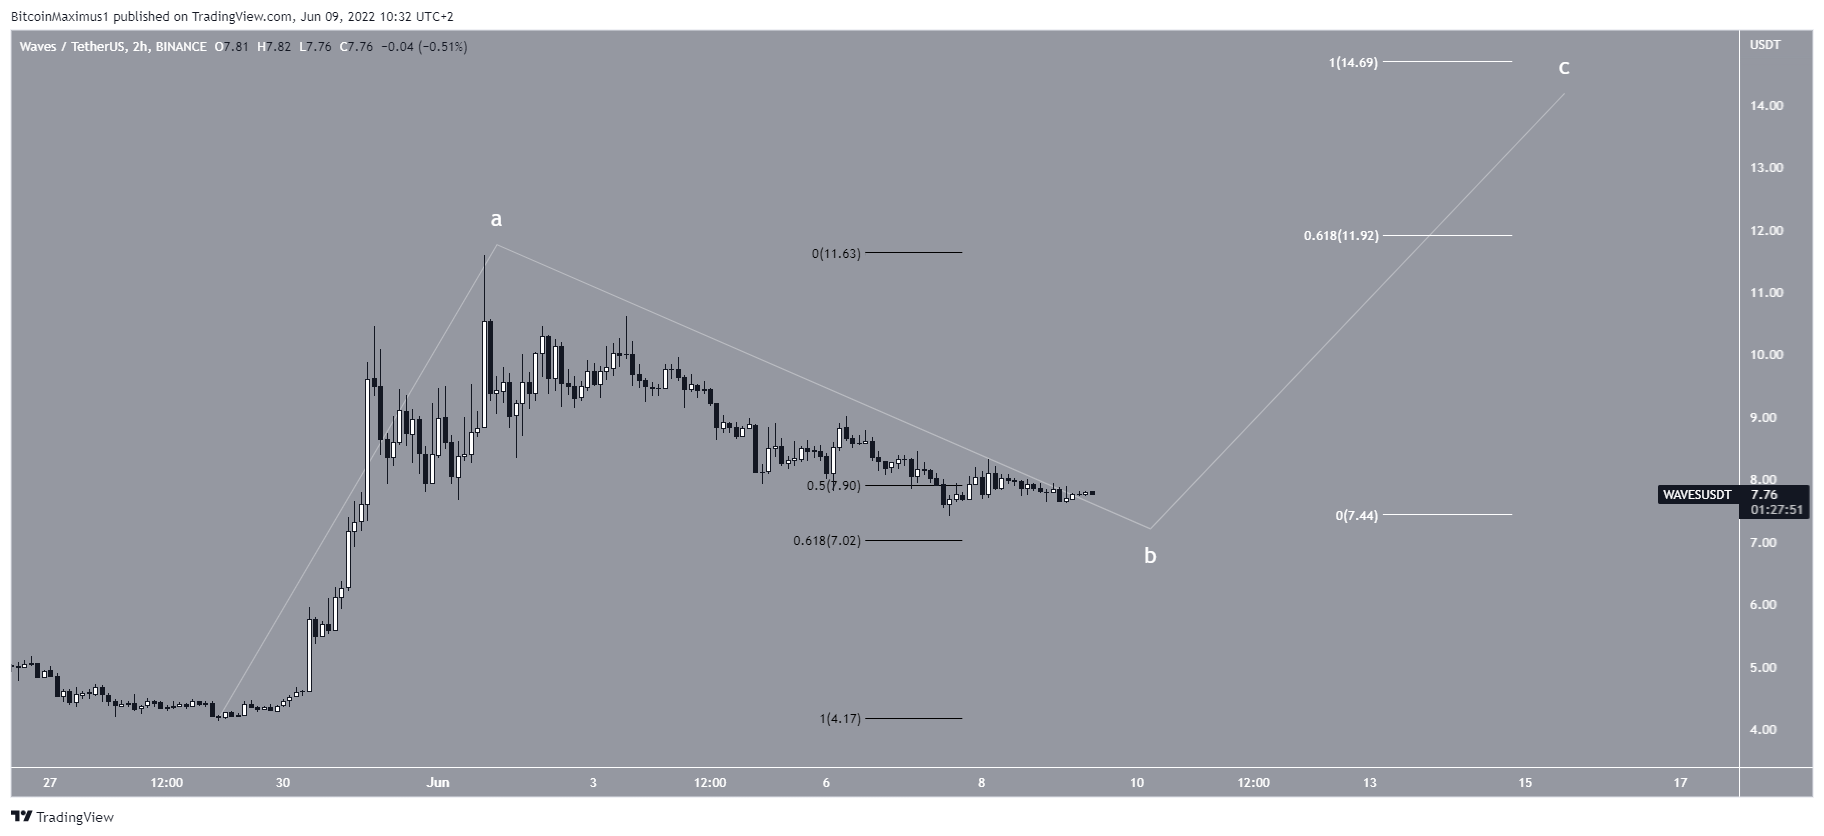
Cryptocurrency trader @PrinceofElliott tweeted a chart of WAVES, stating that the token is completing an A-B-C corrective structure.
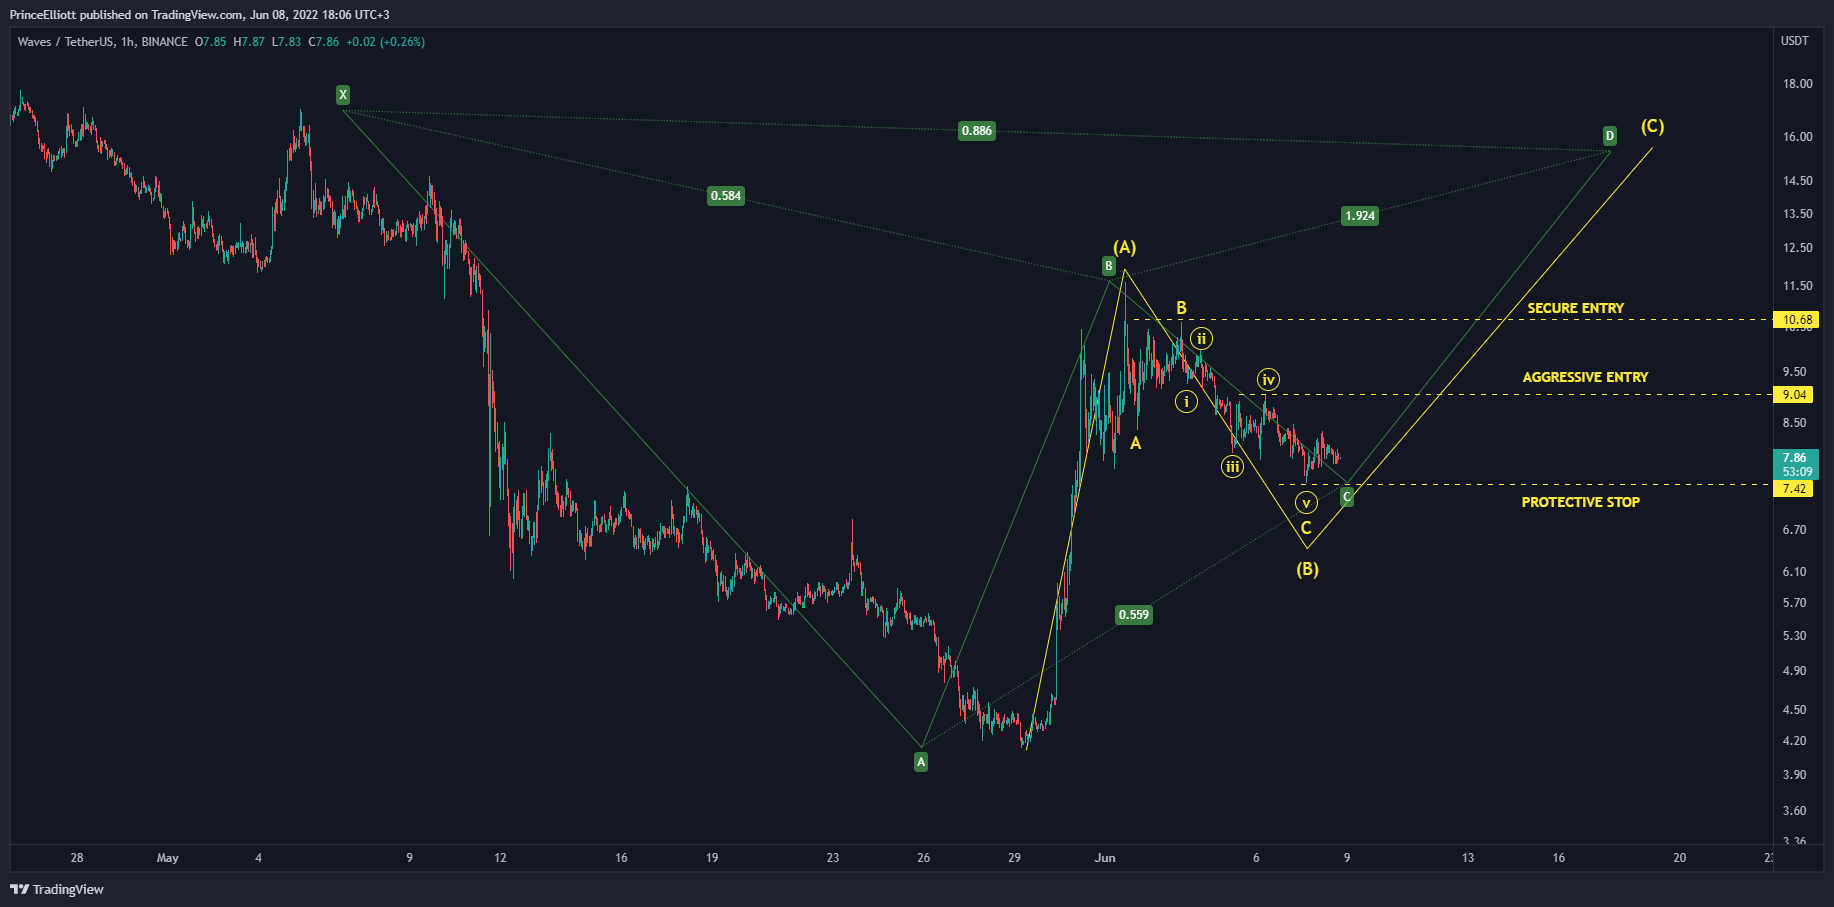
Since the increase beginning on May 30 is a five wave upward movement, it can be labeled as wave A of an A-B-C corrective structure.
In this possibility, the ensuing retracement is part of the B wave. The price is trading inside the 0.5-0.618 Fib retracement support levels, a likely area for the B wave to come to an end.
If correct, the ensuing breakout would take the price to either $12 or $14.70, giving waves A:C a 1:1 or 1:0.618 ratio.
For Be[In]Crypto’s previous bitcoin (BTC) analysis, click here.
What do you think about this subject? Write to us and tell us!