- DOT token witnessed a sharp fall in Saturday’s intraday session as the price fell by almost 7.82%
- The DOT/BTC pair is trailing at 0.000581 BTC with a loss of 3.54% at press time
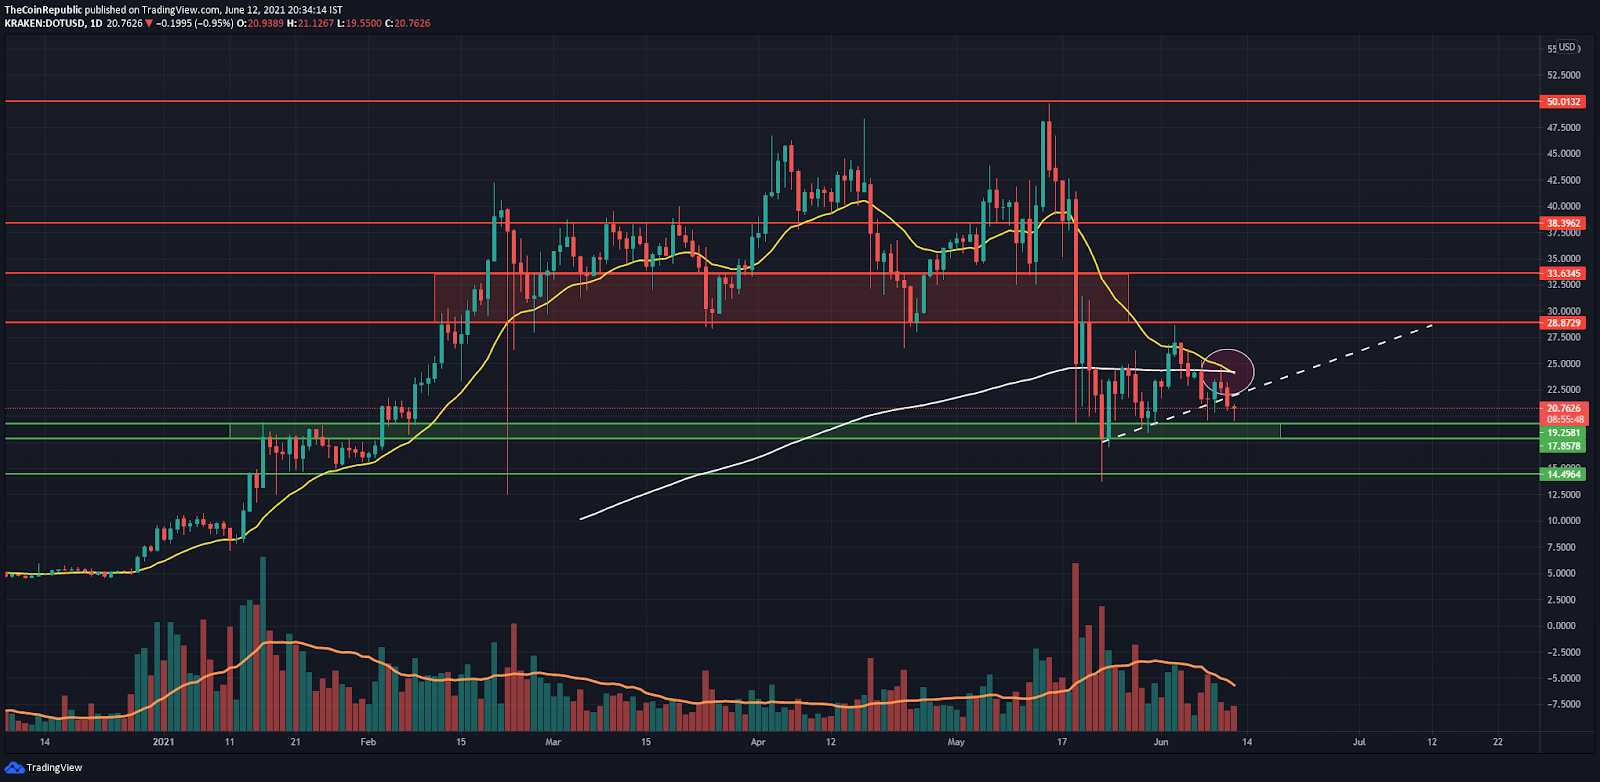
- Critical EMAs hint at the possibility of a Death Cross on the daily chart
As the launch of the upcoming Parachain Slot Auctions nears, DOT price is witnessing some significant price fluctuations. As evidenced by the 7.82% fall in today’s intraday session, this could be the last opportunity for speculators to buy the dip.
Presently DOT is trading at a low of 58% since its ATH while attempting to breach the ascending triangle pattern on the chart. The daily technical of DOT also highlights the fact that the 20 and the 200 EMA are at the threshold of entertaining a bearish cross. The success of which could stimulate DOT to re-inspect the nearest support cushion of $17.85.
On the contrary, there’s a greater possibility that DOT will attempt to reverse from the current price level. A bullish reversal can be distinguished from the fact that the price action has devised a hammer candlestick at the crucial support of $19.52. The prevalence of the bulls could potentially brace the chances of DOT to rise above the 20 EMA and invalidate the Death Cross.
The volume of (711 K) is considerably lower than that of the 20 period Moving Average (1.33 M). High buying pressure will be discovered once the DOT token retrieves the current zone as a critical support level.
According to the coinmarketcap website, DOT is currently ranked #9 while enjoying the Market Dominance of 1.31%. DOT’s trading volume has increased by 24% since the past 24 hours, while its market capitalization has tanked by merely 7.25% concerning today’s price drop.
Dot Price Chart on the 4-hour time frame
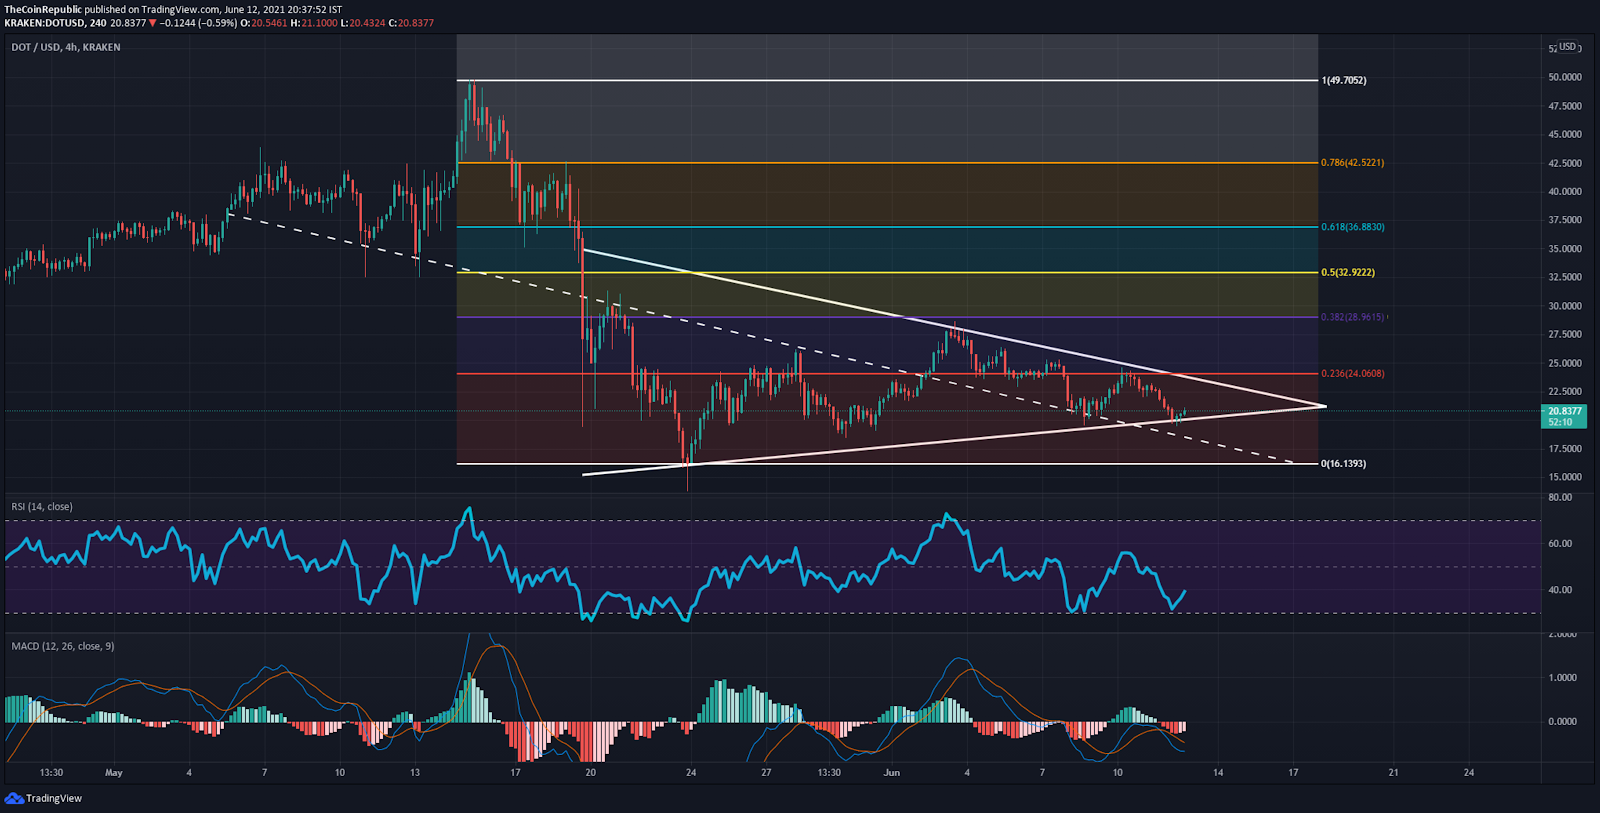
The 4-hour chart of DOT calls attention to the fact that DOT is fluctuating inside the symmetrical triangle pattern since last month’s fatal drop. Yesterday’s rejection from the bearish 0.0236 FIB retracement which lies $24 contributed to DOT witnessing a 7.82% decline today,
On the upside, DOT kickstarted the month of June by flipping the lengthy trend line back as a support barrier and has retested twice since then. However, on the off chance of the price getting rejected from the overhead resistance of $21.57 could lead to DOT revisiting the support trend line.
The technical indicators have forecasted a strong sell signal as displayed by the moving averages, which are above the trend in all time frames.
The RSI (neutral) is showcasing a ‘no trend’ after entering the oversold territory today. While an RSI of 38 is not necessarily oversold, chances are that the oscillator could bottom down again with respect to Bitcoin’s sluggish momentum.
MACD (slighly bullish) is exhibiting a bullish trend as demonstrated by the declining histogram at press time. A bullish crossover between the MACD line and the signal line could plunge the histogram back inside the positive territory.
SUPPORT : $19.52, $17.85
RESISTANCE : $21.57, $24