The Cardano price analysis shows bears are trying to dominate the price function once again and have succeeded so far in their efforts as the price underwent deficit today. The past week had been favorable for the bulls as the price spiked high at a considerable rate on 30 and 31 May 2022. But, today the trends have been reversed as now the bears are at the leading position. It is anticipated that the price will move lower than $0.562 in the coming hours as well as the next support is present at the $0.527 level.
ADA/USD 1-day price chart: price lowers to $0.562 as bears return
The one-day Cardano price analysis is predicting a loss in coin value as the bears are trying to lower the price levels. The successive uptrend has been reversed as now the bears are leading the price charts for the past few days. The price underwent a slight decline and dropped down to the $0.562 level during the day resulting in a 0.55 percent decrease in value over the last 24 hours. However, the price is still above the moving average (MA) value which is standing at $0.55 at present.
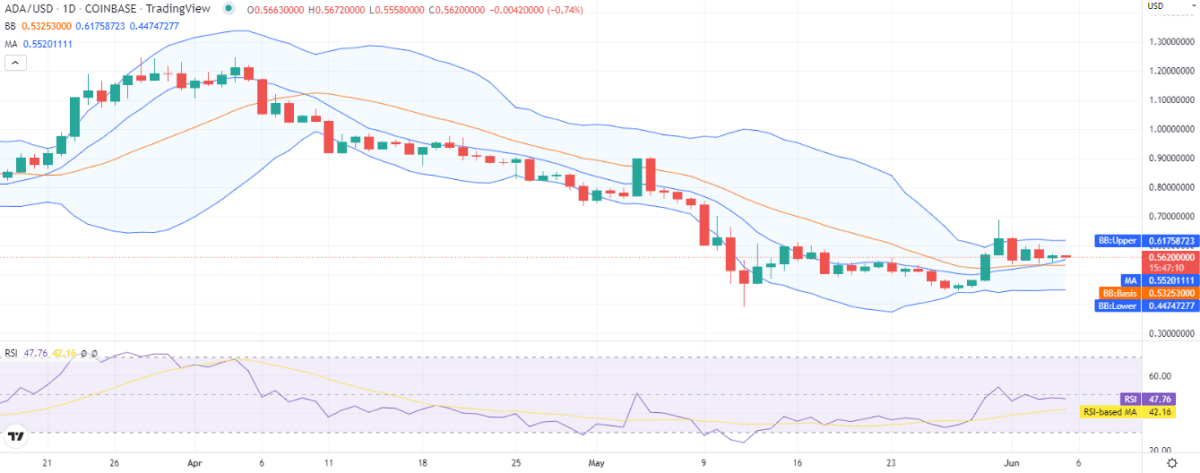
The Bollinger bands Indicator shows comparatively high volatility with its mean average line forming at $0.532, while the upper value is at $0.617 and the lower value is at $0.447. The Relative Strength Index (RSI) score is quite neutral and the indicator is showing a reading of 47 for the day. The curve of the indicator hints at a lack of momentum from either side of the market.
Cardano price analysis: Recent developments and further technical indications
The four-hour Cardano price analysis is dictating a loss in price value as the bears have returned to the price chart again. Red candlesticks have been prevailing for the first eight hours of the trading session. However recently support has arrived for ADA as a green candlestick is emerging. The recent downtrend has brought the price near the moving average value which is $0.559.
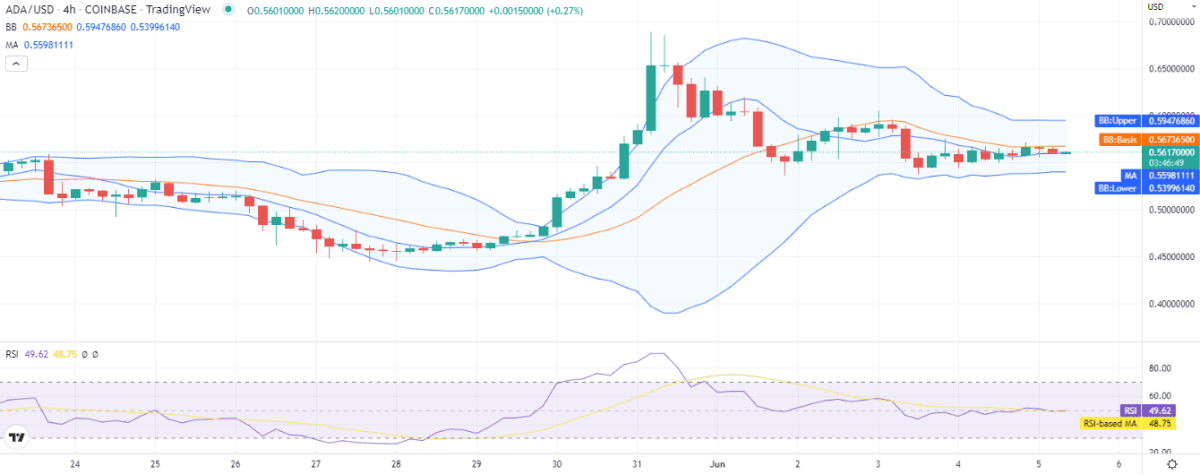
The volatility has been low as the upper and lower Bollinger bands values of the indicator have been maintained at $0.594 and $0.539 respectively. The RSI score has decreased slightly because of the bearish trend, but the indicator is hovering at index 49.
Cardano price analysis: conclusion
The Cardano price analysis indicates the price is following a downwards trend as bears made a comeback today. The cryptocurrency price has dropped to the $0.562 level and is expected to move down even further. The hourly price chart is predicting the same as the price underwent a decline at the start but has been increasing again in the last four hours as well. The chances of recovery might resurface only if the support continues from the buyers’ side.
Disclaimer. The information provided is not trading advice. Cryptopolitan.com holds no liability for any investments made based on the information provided on this page. We strongly recommend independent research and/or consultation with a qualified professional before making any investment decisions.