Aave price analysis today shows that the digital asset is currently in a strong bearish grip as it slides down to $106.33. The coin has seen consistent selling pressure since yesterday and the bears seem to be in control at the moment. Looking at the hourly chart, we can see that AAVE/USD slipped below the ascending parallel channel yesterday and fell towards the $106 mark. The coin managed to find support around this level and is currently trading around $106.33.
The market has been facing rejection at the $110.99 level since then and has found support at $101.83 as prices continue to fluctuate between these two levels. The bears are currently in control of the market, and a further price drop is expected in the next 24 hours. The cryptocurrency has a market trading volume which is at $232,918,722, with a market capitalization of $1,472,964,292 The digital asset is ranked in the 21st position on CoinMarketCap.
AAVE/USD 1-day price chart: Bears are in control as Aave prices fail to breakout
Aave price analysis shows that the coin is facing resistance at $110.99.However, if the selling pressure persists, we could see Aave prices fall towards the $101.83 support level in the next 24 hours. On the other hand, a breakout above the $110.99 level could see Aave prices resume their uptrend as the bulls target the $120 resistance level.
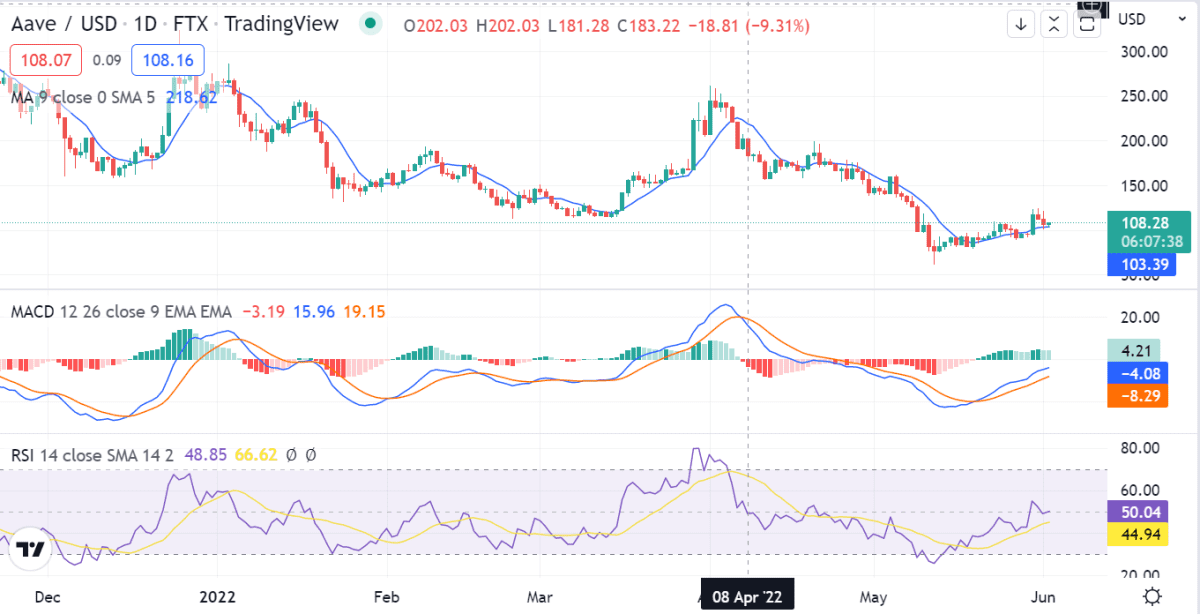
The Relative Strength Index is currently trading at 42.73 and is indicative of neither oversold nor overbought conditions in the market. The Moving Average Convergence Divergence indicates that the market is in a bearish phase as the MACD line (blue) is trading below the signal line, while MA 50 (yellow) is also trading below MA 200 (purple).
Aave price analysis on a 4-hour price chart: Bears continue to put pressure on Aave prices
Aave price analysis on a 4-hour timeframe is bearish as the coin has been found trading at the $106.33 level and support at $101.83. The market is currently facing resistance at the $110.99 level, and further selling pressure could see Aave prices drop to $101.83 in the next few hours. Investors should exercise caution as the market is highly volatile.
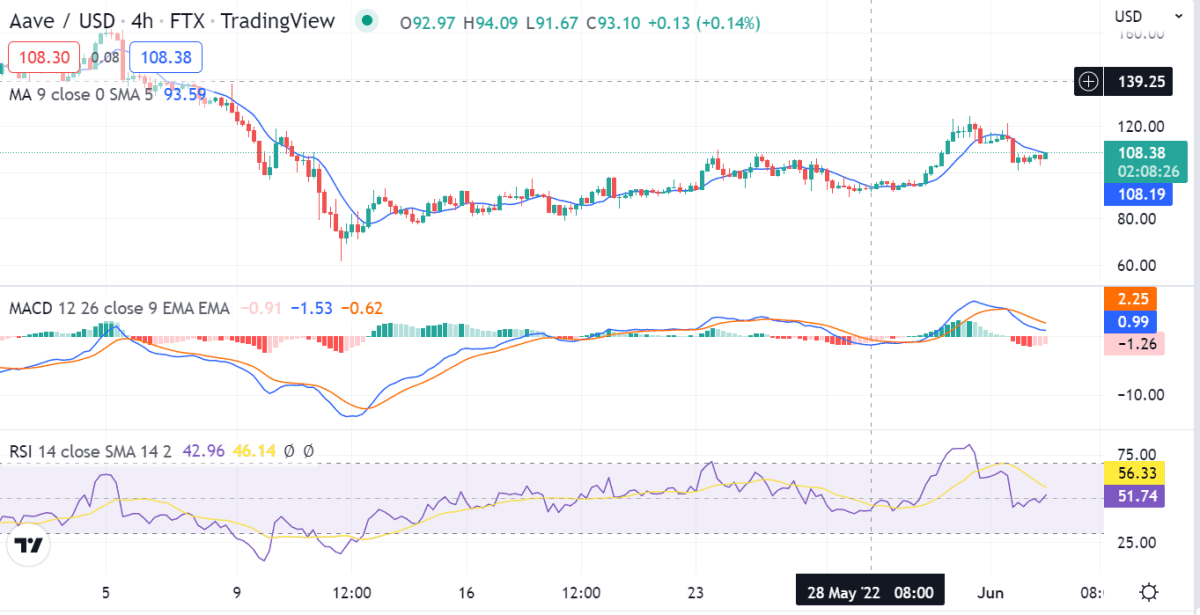
The 4-hour chart also shows that the Relative Strength Index is currently trading below the 50 level, which is indicative of bearish conditions in the market. The MACD line is also trading below the signal line, indicating that the market is in a bearish phase. The MA 50 is also and MA 200 is bearish as both are trading below the current market price.
Aave price analysis conclusion
To conclude, Aave’s price analysis is bearish as it has been confirmed from the one-day and four hours. Although the price went higher at the start of the trading session, following yesterday’s bulls trend, the bears are now back on track as they have been able to bring the price down to the $106.33level. The cryptocurrency is to face more loss in the future as the hourly prediction has been on the unfavorable side as well. Hence, it will be better to sell on the rise and wait for a dip to enter. Looking at the technical indicators, it seems like the market is heading towards the $101.83 support level in the next few hours.
Disclaimer. The information provided is not trading advice. Cryptopolitan.com holds no liability for any investments made based on the information provided on this page. We strongly recommend independent research and/or consultation with a qualified professional before making any investment decisions.