- The KAVA token eventually recovered above the $3.0 mark, but failed to manage costs above it.
- KAVA price again remains below the 20 and 50-day exponential moving averages throughout the duration of the daily price scale.
- The KAVA token belonging to the bitcoin pair shows a 0.8% lower momentum at 0.000008751 Satoshis.
At the time of writing, KAVA token is trading below the $3.0 level, which acts as a short-term bullish hurdle. On May 13, KAVA’s price recovered from the $1.6 level. The resulting rally surged up to 129% and hit the $3 overhead resistance two mark (near the 50 EMA).
However, this recovery rally resonates with the rising wedge channel of the inverted flag pattern, suggesting that the coin’s price could eventually drop to the $1.6 level. Meanwhile, the $2.3 level was viewed as a hedge for buyers.
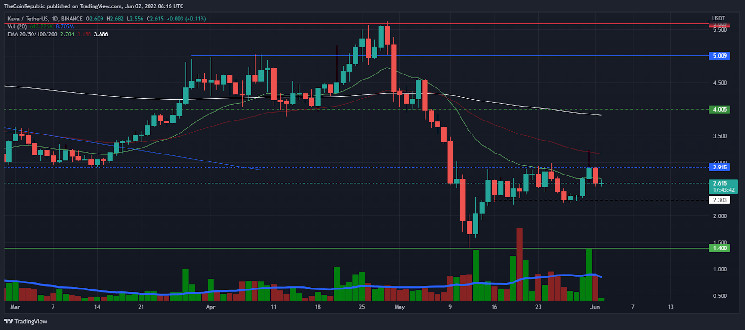
Thus, the bears again turned aggressive near the 50-day exponential moving average on the daily price chart, with the bulls struggling below the 20 EMA. But short-covering could happen if the bulls manage the $2.5 mark. Meanwhile, KAVA was trading at the $2.61 mark at that time.
The market cap fell 6.2% to $525 million during the retracement as per the CMC’s last 24 hours. Furthermore, the KAVA token belonging to the Bitcoin pair 0.000008751 shows 0.8% lower momentum on Satoshis.
However, trading volume shows a highly volatile session this week. But on the other hand, traders reported a 67% drop in volumes in the last 24 hours.
Bears placed his sell order at 20 EMA
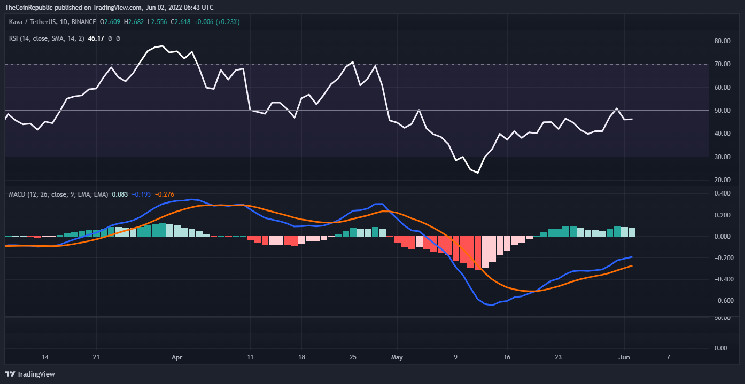
In terms of the daily price chart, the RSI indicator found a rejection near the halfway mark (50 mark) after reversing from the oversold zone. But now it seems to be flat below the 50 mark.
Similarly, MACD moves up after a bullish crossover, but remains in negative territory.
Conclusion
If the KAVA price falls below the $2.3 mark (support area), buyers could see another downside correction. But short-covering could happen if the bulls manage the 50 EMA along with the $2.5 mark.
Technical Levels
Support level – $2.3 and $1.0
Resistance level – $3.0 and $.0
Disclaimer
The views and opinions stated by the author, or any people named in this article, are for informational ideas only, and they do not establish the financial, investment, or other advice. Investing in or trading crypto assets comes with a risk of financial loss.