The Polkadot price analysis shows a bullish trend for today, as the price has slightly moved up to reach the $9.46 position. The bullish activity has been commendable as throughout bears were in control and the cryptocurrency was degrading regularly for the past 16 hours, but now the recent upwards price movement is a positive sign for cryptocurrency value.
The bulls have found their way to reestablish their position above $9.4, and a further increase in DOT/USD price can be expected given the following bullish streak.
DOT/USD 1-day price chart: DOT bulls need more positive market sentiment for further up move
The 1-day Polkadot price analysis chart is showing that the price has increased slightly today as it has reached a $9.46 value. There has been a major drop in the price earlier yesterday which had left damaging effects on the cryptocurrency value. This can be confirmed by the fact that despite the recovery, the coin is still at a loss of 7.84 percent for the past 24 hours, and 2.19 percent for the past week.
The trends have seen a slight shift today as the price levels are on their way to recovery at a slow pace. The moving average (MA) has been rising and has reached $9.72 as there have been bullish wins in the prior weeks as well.
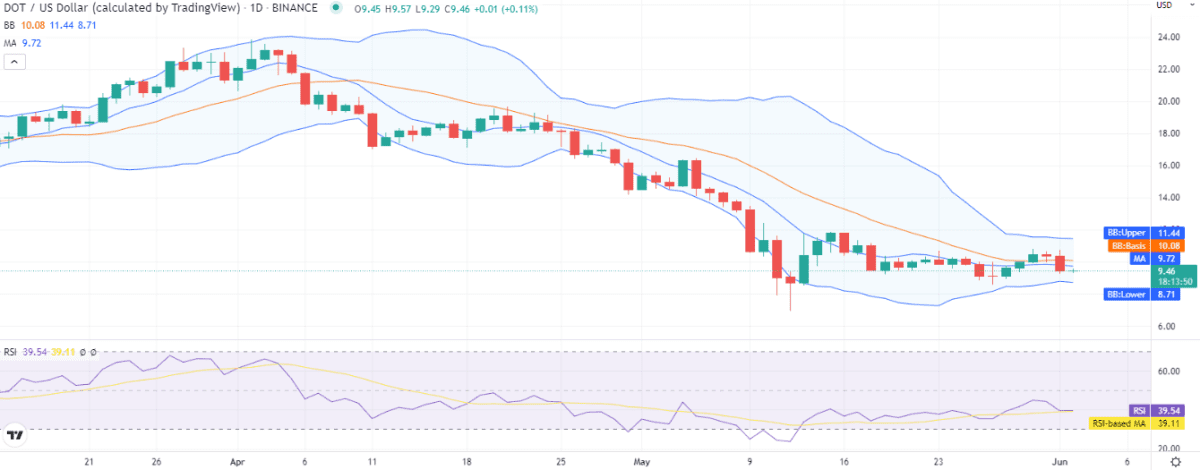
The volatility has been low which has caused the upper Bollinger band value to be maintained at $11.44 representing the strongest resistance and the lower value to be $8.71, representing the strongest support for the DOT price value. The Relative Strength Index (RSI) is trading on a horizontal line and the score has not increased above index 39 which hints at a weak bullish momentum.
Polkadot price analysis: Recent developments and further technical indications
The 4-hour Polkadot price analysis is indicating that the price fell sharply during the last 16 hours. However, the price movement is upward for the last four hours as the support arrived for the coin’s price. The progress has been quite appreciable as the bulls have elevated the price slightly above yesterday’s price cap marking the trend bullish for today at the time of writing.
The price has successfully traveled to the $9.47 level, as the bulls made a comeback. The 4-hours DOT/USD price chart is showing the moving average value at $9.90, and the Bollinger bands average at $10.15.
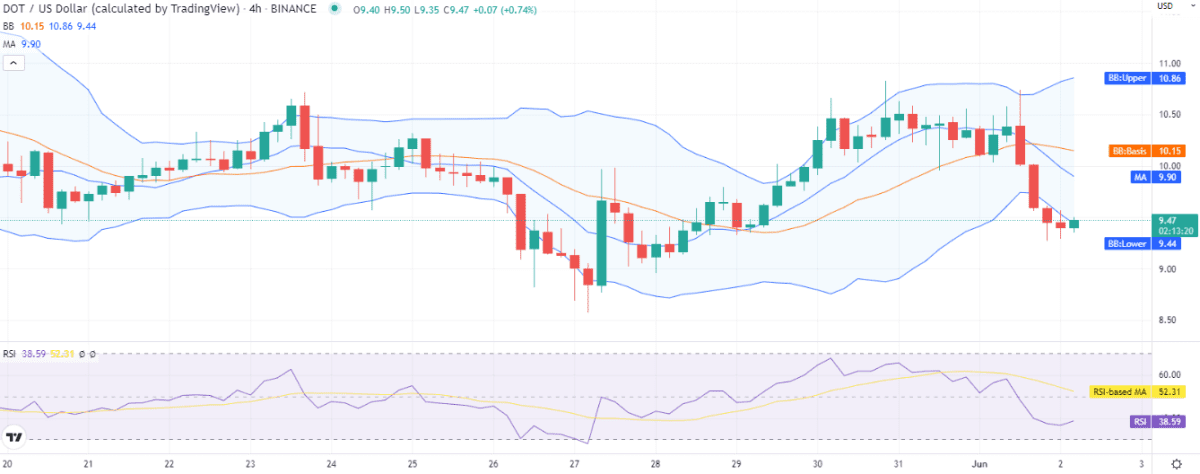
The volatility has increased significantly which is also positive news for cryptocurrency. As a result, the Bollinger band values have readjusted themselves as such that the upper band is now at $10.86, leaving the lower band at $9.44, and the price has traveled above the lower band. Lastly, the RSI curve has reached index 38 and may rise further as bullish momentum gains strength.
The buyers and sellers have given each other quite a tough time, which is why the technical indicators are giving negative signals. There are 10 indicators that have secured the neutral position, with 14 indicators at the selling and only two indicators at the buying positions.
Polkadot price analysis conclusion
The following 1-day and 4-hours Polkadot price analysis is giving encouraging signs for the buyers as there has been noted an increase in the price over the past four hours. The DOT/USD price value is recovering after a huge loss and has now reached the $9.47 level. There is a possibility of the coin price going further up in the coming hours if bullish momentum gains strength.
Disclaimer. The information provided is not trading advice. Cryptopolitan.com holds no liability for any investments made based on the information provided on this page. We strongly recommend independent research and/or consultation with a qualified professional before making any investment decisions.