Despite the attempted recovery this week following nine consecutive red weekly candles, the overall market structure remains bearish, and there is no indication of a trend reversal.
Technical Analysis
By Grizzly
The Daily Chart
On a daily timeframe, Ripple has traded below the long-term rising line (in orange) for the last three weeks. This trend line has accompanied the price since the Covid crash.
Ideally, buyers should be able to push the price above this line. Suppose they can do so and push above the horizontal resistance at $0.55. In that case, there will be a substantial decline in the bearish sentiment. However, this also means that XRP needs to increase by 35% from the current levels.
As long as the discussed scenario does not occur, the overall outlook for the market remains bearish, and it is more likely to see lower levels or, in the best scenario, a sideways trend.
Key Support Levels: $0.33 & $0.24 & $0.17
Key Resistance Levels: $0.47 & $0.55 & $0.65
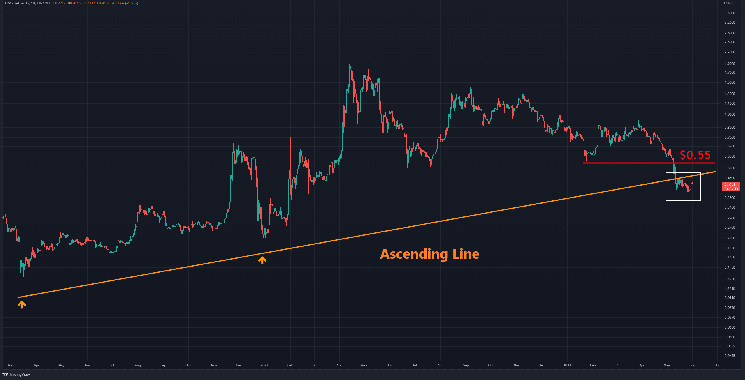
Moving Averages:
MA20: $0.4
MA50: $0.55
MA100: $0.66
MA200: $0.74
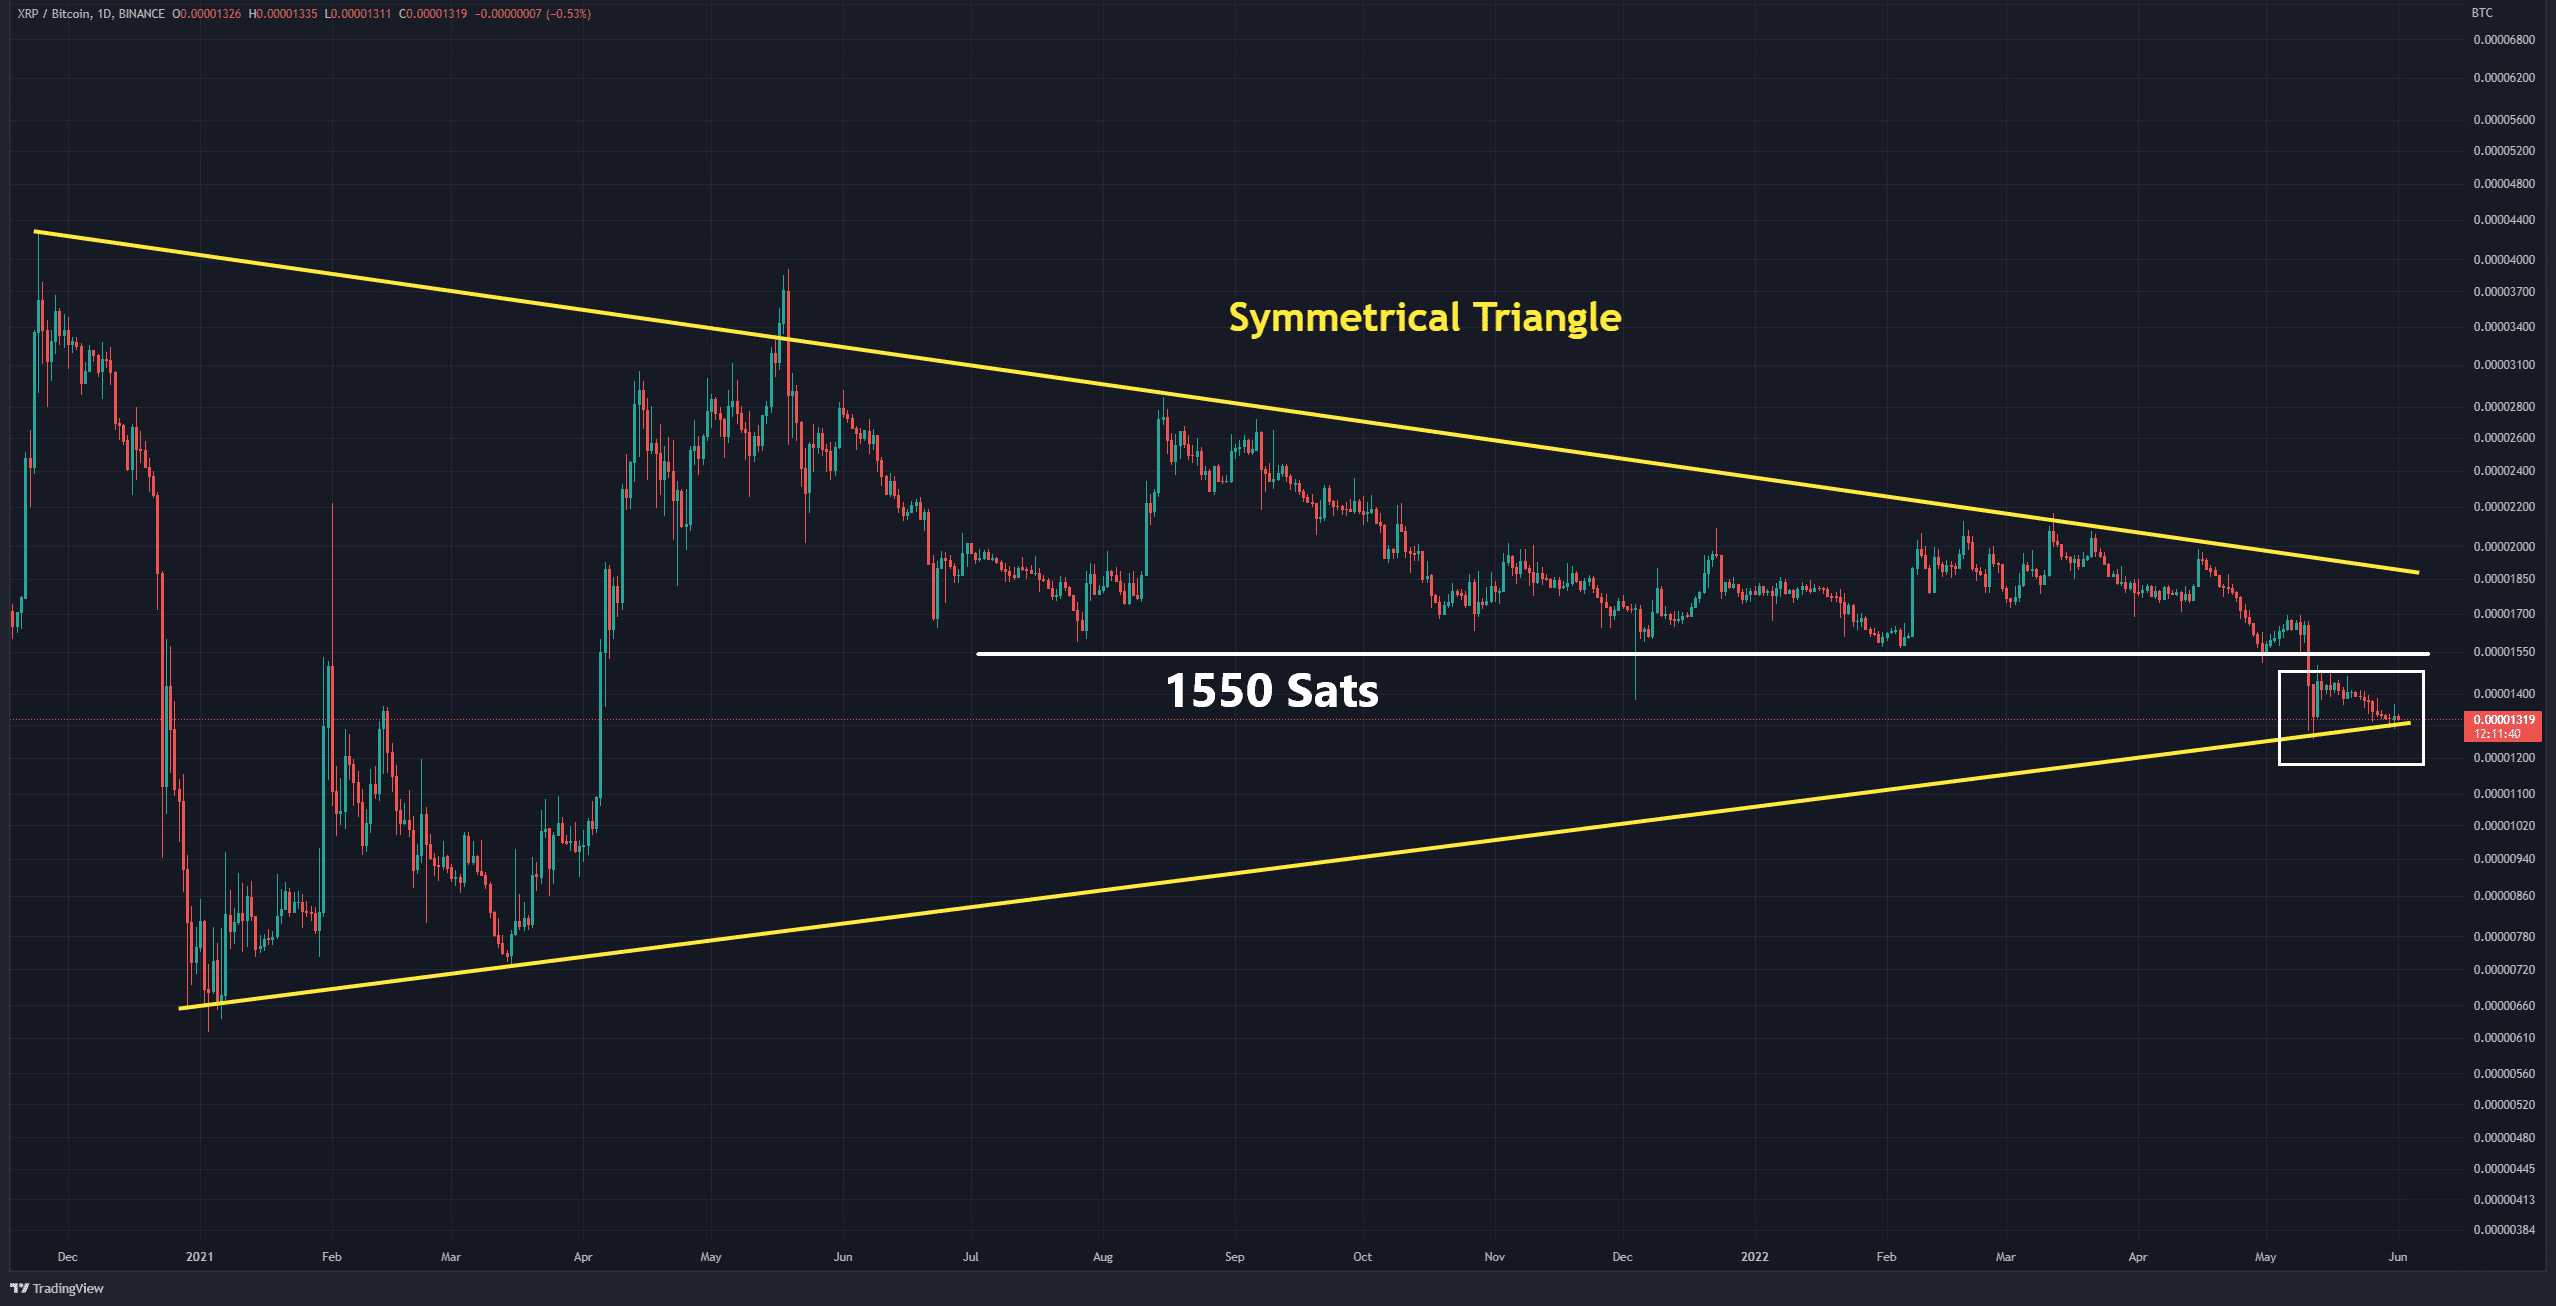
The XRP/BTC chart
Against BTC, the cryptocurrency has fluctuated for more than 550 days within the triangle. The bottom of the triangle acts as a support. If the bears manage to cross below the mentioned line, the next target would be the horizontal support at 1100 Sats.
Based on the weak candle structure and the bearish sentiment in the market, this scenario is not unlikely – unless buyers enter the market in force and turn the page and be able to return above 1550 Sats.
Key Support Levels: 1270 Sats & 1100 Sats
Key Resistance Levels: 1500 Sats & 1700 Sats