Bitcoin (BTC) is trading inside a symmetrical triangle.
Ethereum (ETH) is potentially trading inside an ascending triangle.
XRP (XRP) is trading inside a descending parallel channel.
Kava.io (KAVA) is in the process of breaking out from a descending resistance line.
Zcash (ZEC) is approaching the $200 resistance area.
Algorand (ALGO) has bounced at the long-term $0.70 area but is still following a descending resistance line.
Cosmos (ATOM) is following a descending resistance line.
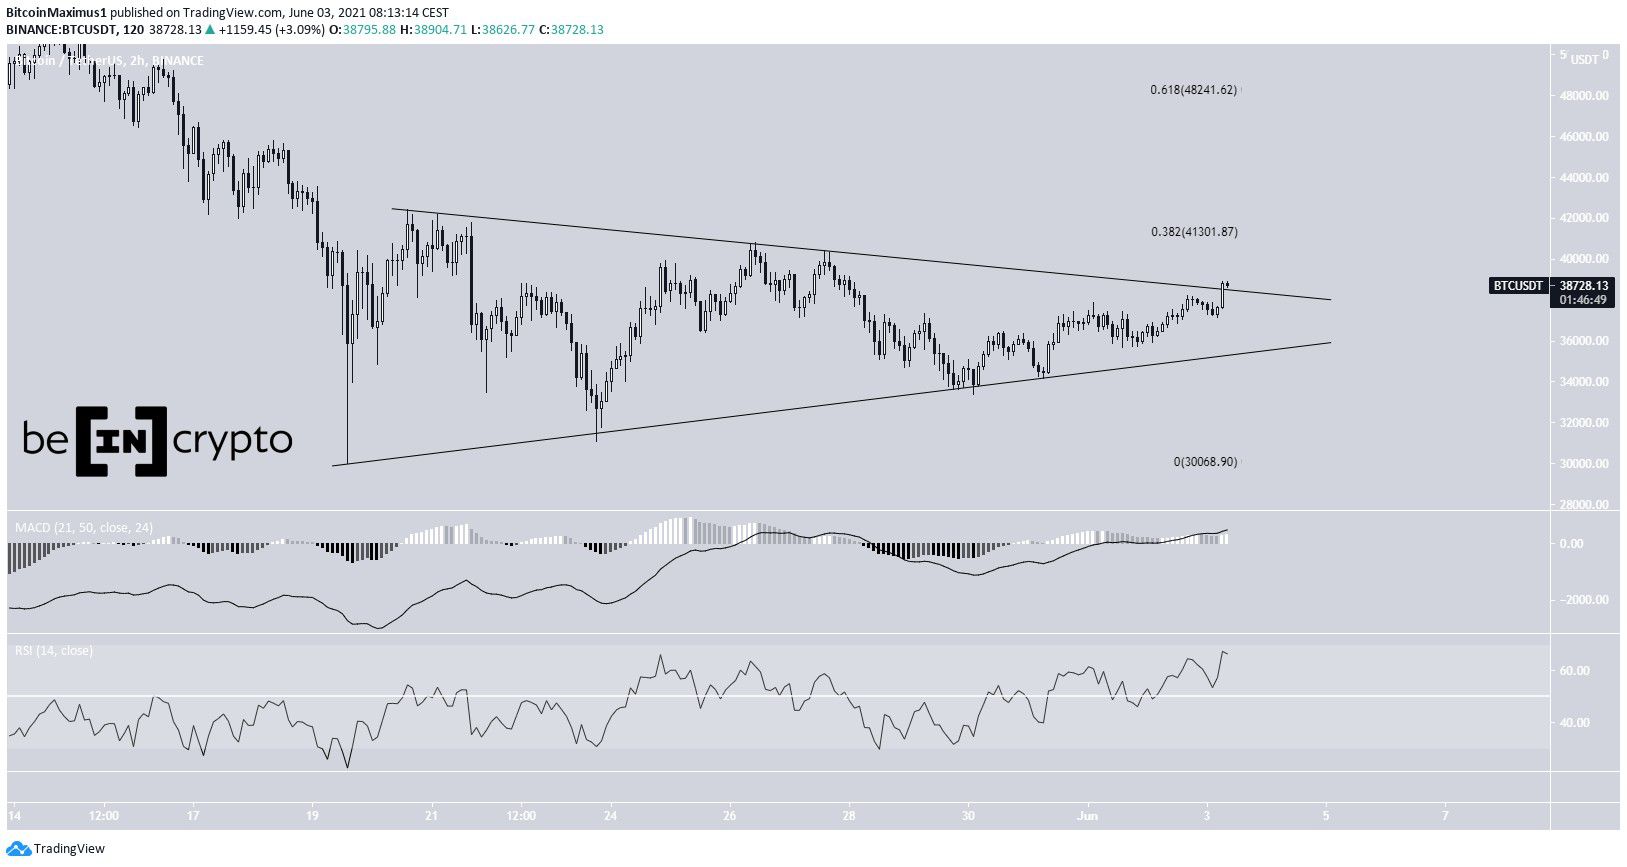
BTC
Since reaching a low on May 19, BTC has been trading inside a short-term symmetrical triangle. This pattern is normally considered a neutral formation.
Currently, it’s in the process of breaking out from this triangle, which would be a major bullish development.
If so, the next resistance levels would be found at $41,300 and $48,250.
Both the RSI and MACD support the validity of the breakout.
For a more in-depth analysis, click here.
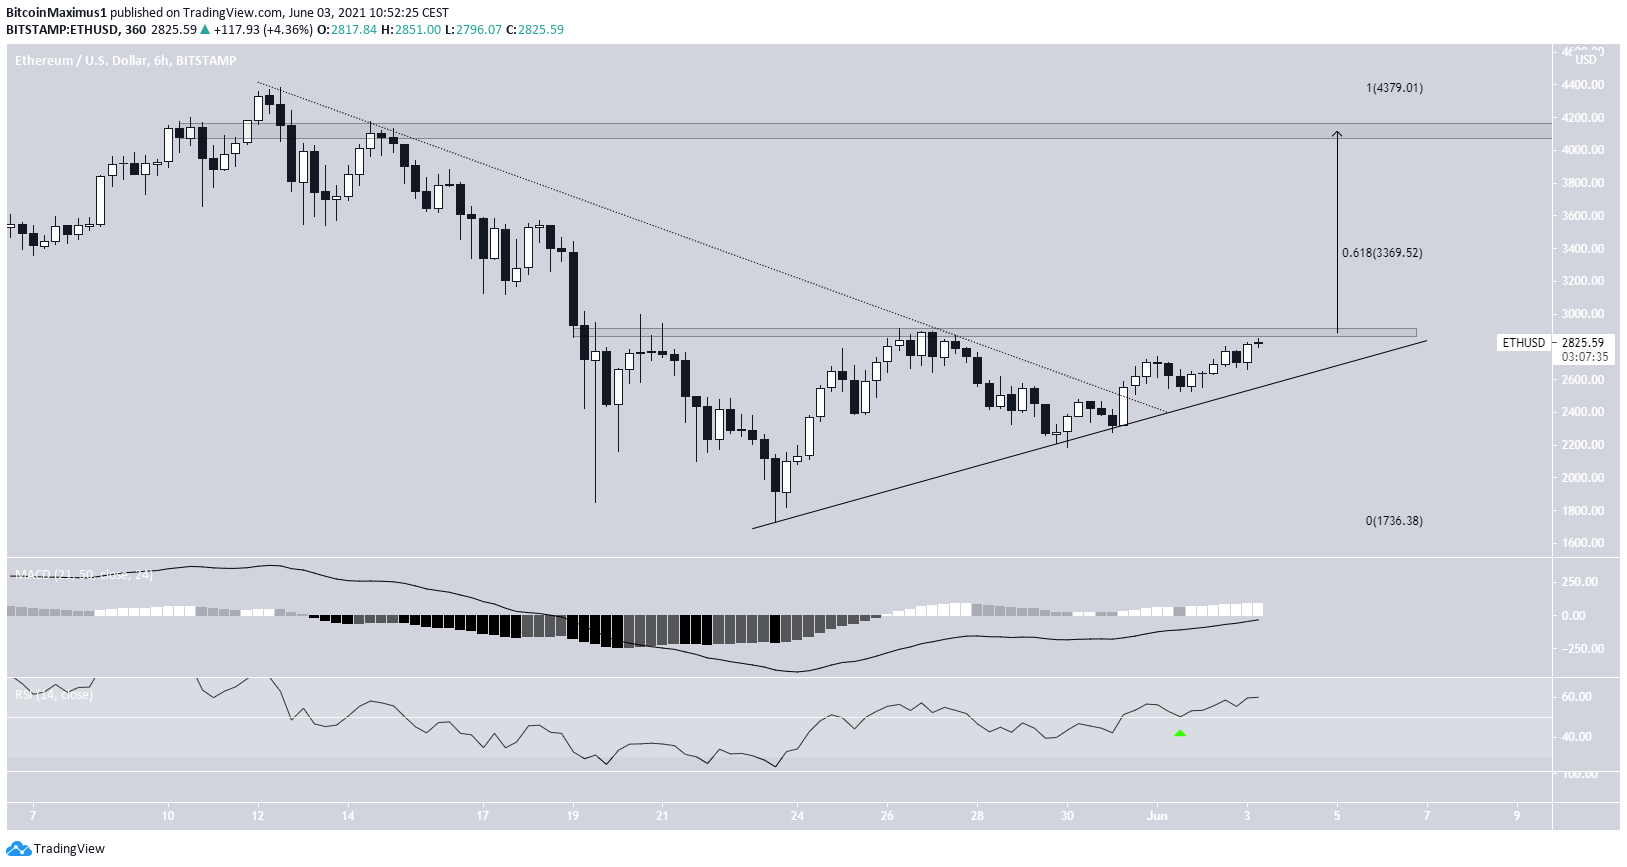
ETH
ETH had been following a descending resistance line since May 12. On May 30, it managed to break over this resistance and has been moving upwards since.
The main resistance area is found at $2,850. Alongside a potential ascending support line, it’s possible that ETH is trading inside an ascending triangle.
While the next resistance area is found at $3,370, a movement that travels the entire height of the pattern could take ETH all the way to $4050.
Both the MACD and RSI support the possibility of a breakout.
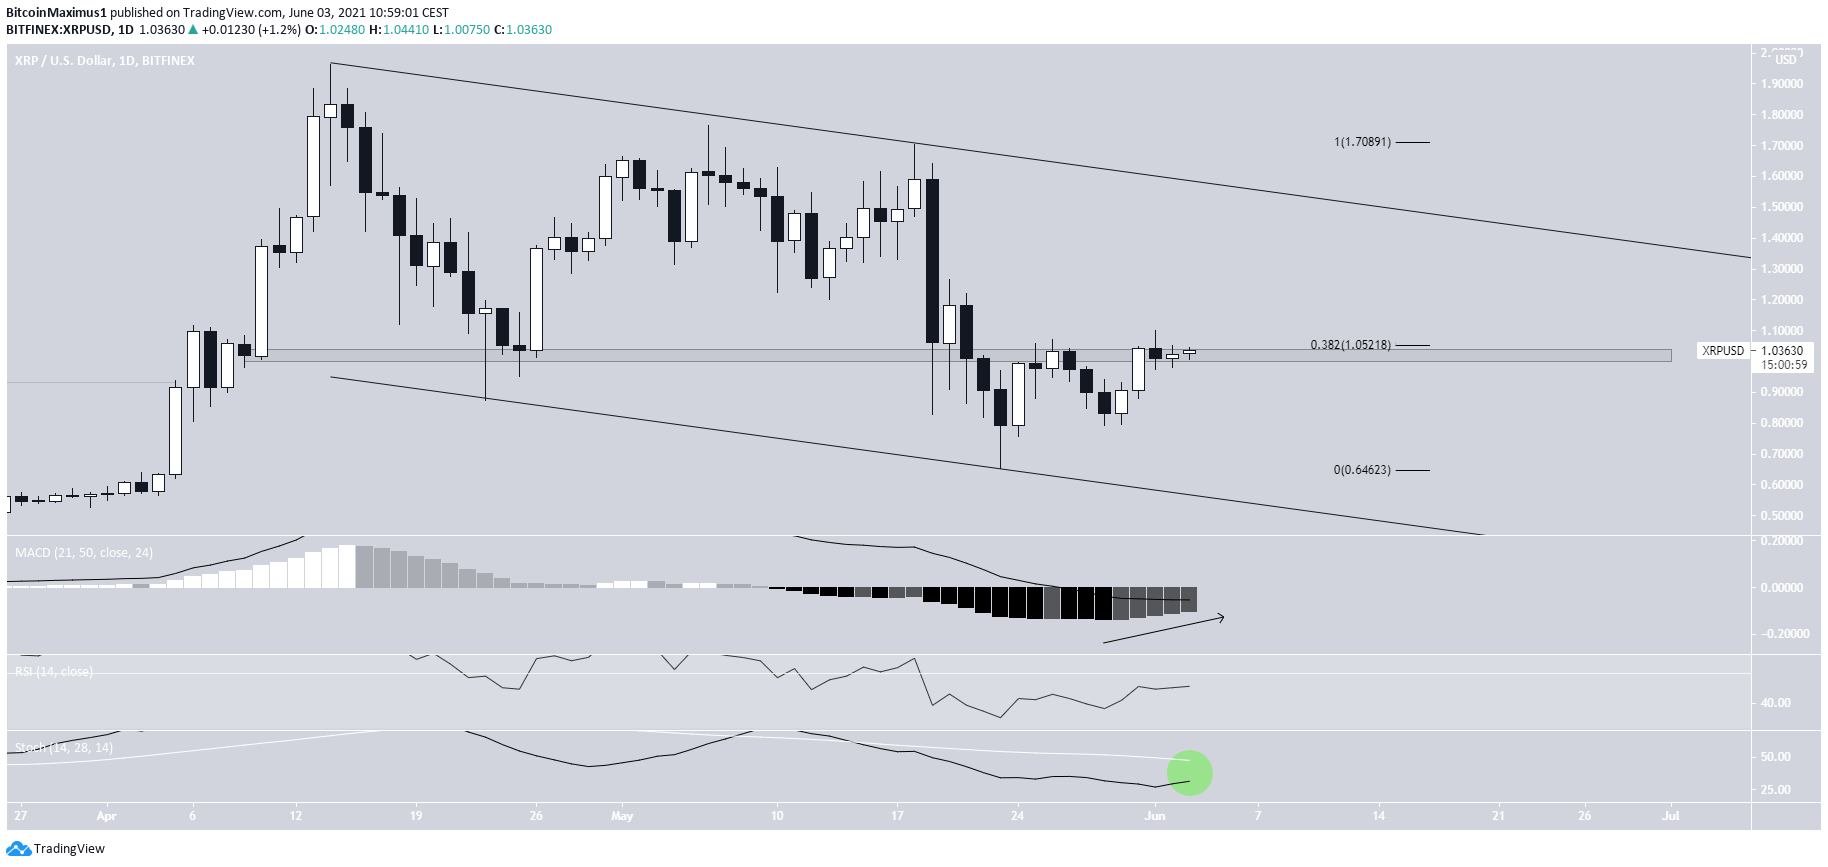
XRP
XRP is currently in the process of moving above the $1.05 area. This is a crucial horizontal resistance level and the 0.382 Fib retracement level of the most recent downward movement.
If successful in reclaiming the $1.05 level, XRP could likely increase all the way to the resistance line of the current descending parallel channel at $1.48.
Technical indicators are showing some bullish signs but have yet to confirm a bullish trend reversal.
While the MACD is increasing, the RSI has yet to cross above the 50-line. Furthermore, the Stochastic oscillator has yet to make a bullish cross (green circle). In order for the bullish trend to be confirmed, both of these indicators would have to continue moving up.
KAVA
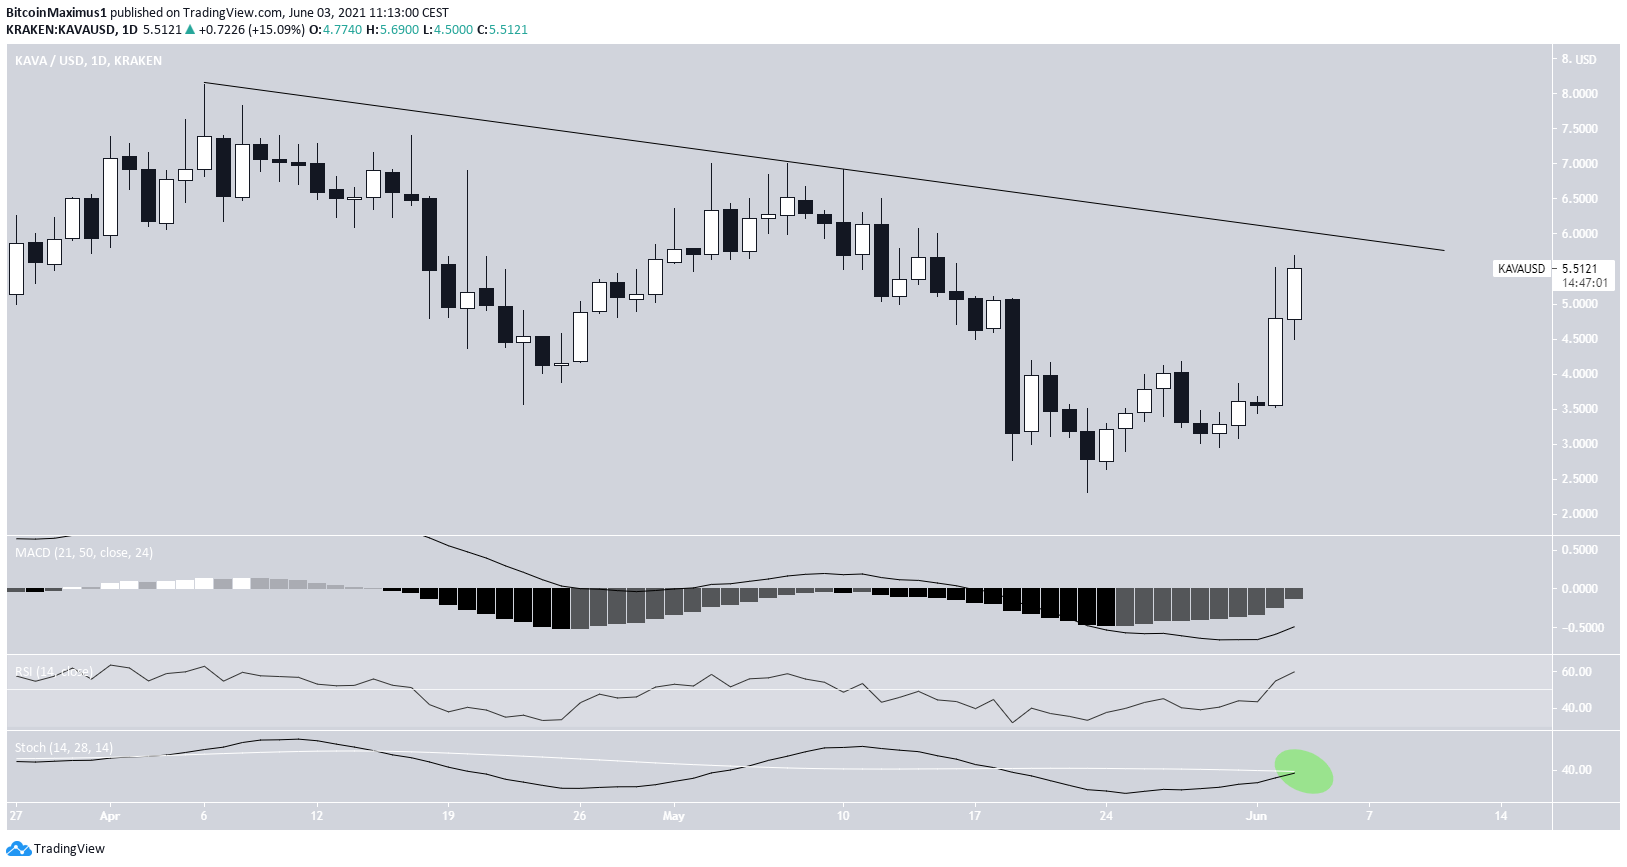
KAVA has been following a descending resistance line since reaching an all-time high price of $8.13 on April 6. So far, it has made two unsuccessful breakout attempts.
The recovery after the May 23 low has been extremely swift and KAVA has almost reached the descending resistance line once more.
A breakout would likely take it towards the all-time high price of $8.13.
Technical indicators on the daily chart support the breakout possibility. The Stochastic oscillator has just made a bullish cross (green). The RSI is in the process of crossing above 50 while the MACD is almost positive.
ZEC
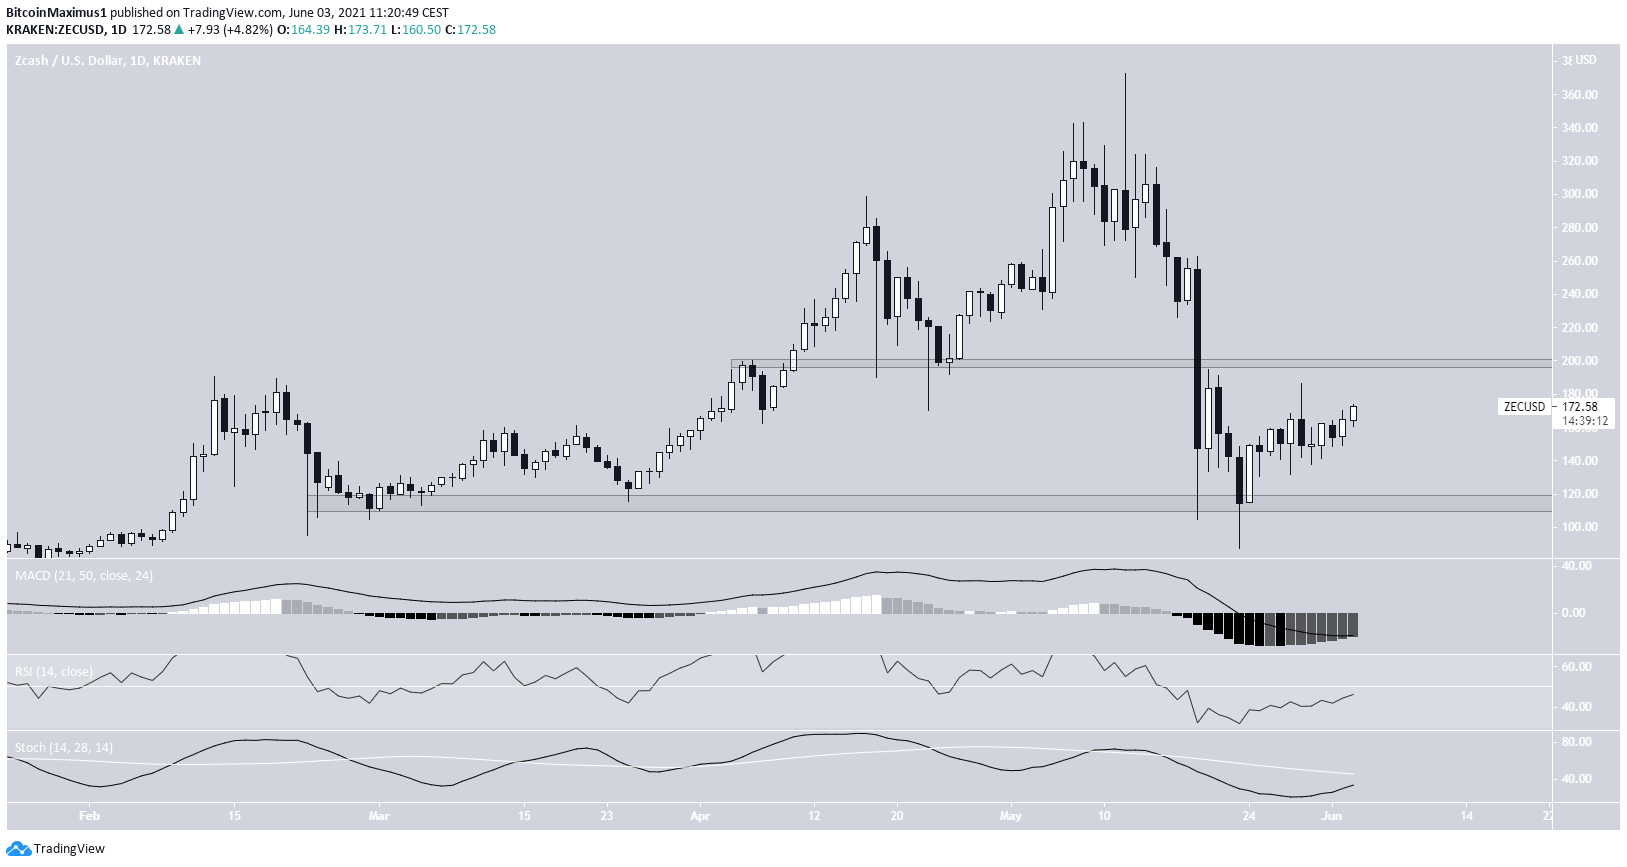
ZEC has been increasing since bouncing on May 19. At the time, it had reached a low of $105.
Currently, it has returned to trading at $172 and is approaching the main resistance area at $200.
Technical indicators are gradually turning bullish, but have yet to confirm a bullish trend reversal. An RSI cross above 50 and a bullish cross in the Stochastic oscillator would be required for confirmation.
Until the $200 area is reclaimed, the trend cannot be considered bullish.
ALGO
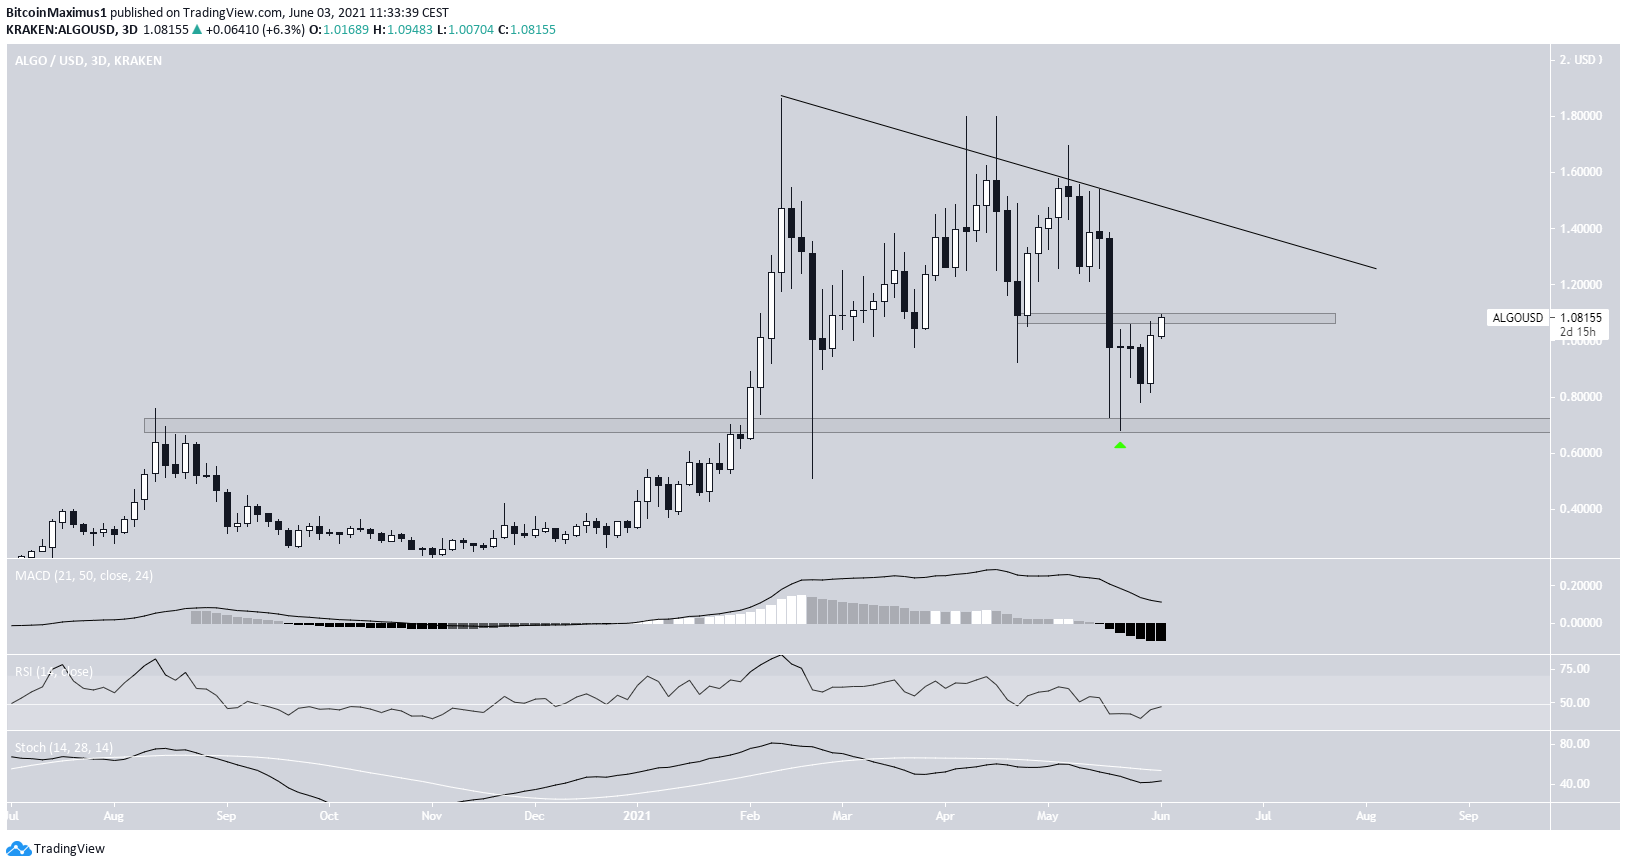
On May 22, ALGO reached a low of $0.68 and bounced sharply. This was an extremely positive development because the area acted as its previous August 2020 all-time high. Therefore, the ongoing decrease looks like a bullish retest.
ALGO has been moving upwards since, reaching the $1.08 minor resistance area. In addition, it’s following a descending resistance line.
Technical indicators are still neutral.
Therefore, despite the bullish price action, we cannot yet state that the trend is bullish.
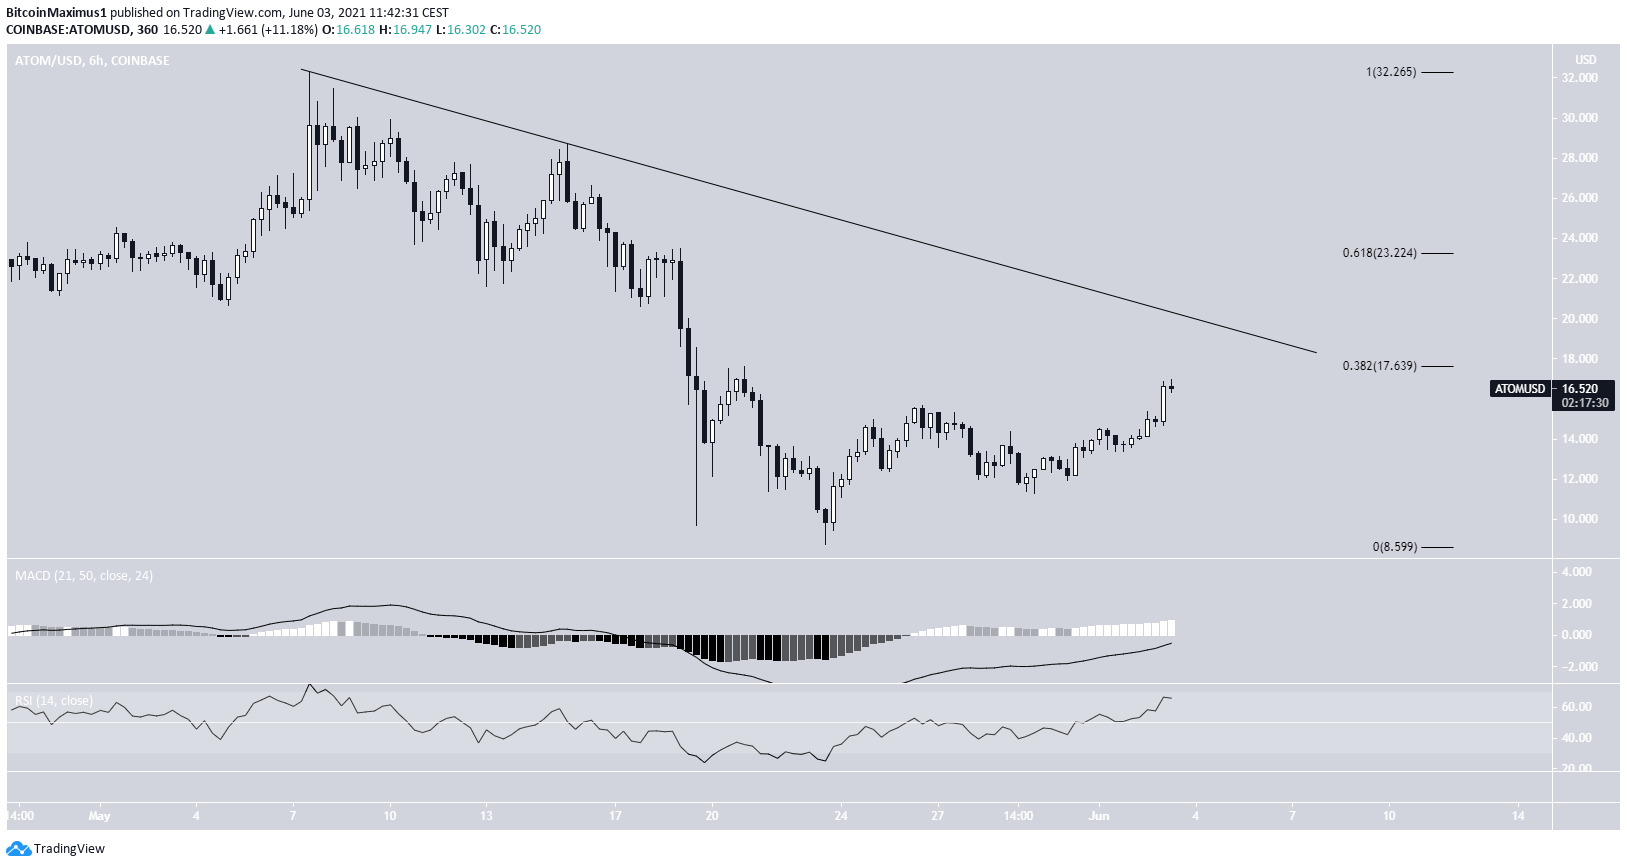
ATOM
ATOM has been following a descending resistance line since reaching an all-time high price of $32.35 on May 7.
The line coincides with the 0.382 Fib retracement resistance level at $17.60.
Until ATOM manages to break out above this resistance, the trend cannot be considered bullish.
The short-term MACD and RSI both support the likelihood of a breakout.
The next resistance area would be found at $23.22.