Polkadot is a blockchain-based platform for high scalability, innovation, and security. It is also a fork-resistant network with data availability and validity capabilities. It is a Proof-of-Stake network that allows users to add para-chains by bonding tokens. DOT is the native token of this ecosystem. The following DOT technical analysis predicts the price trends for the next two days:
Past Performance
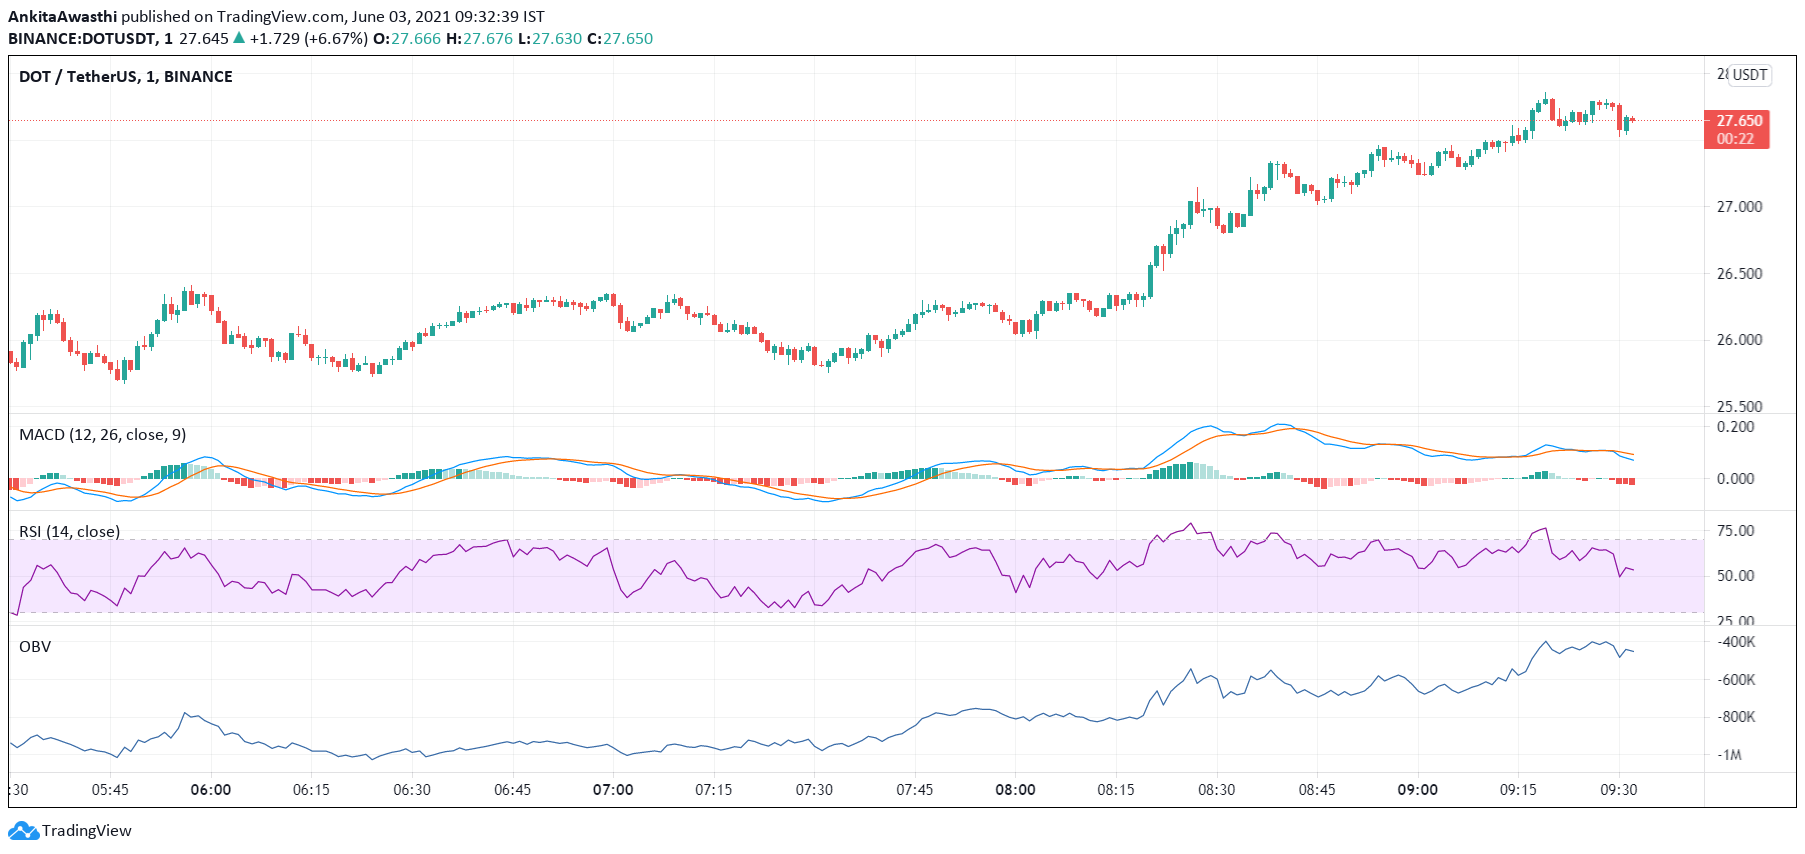
On May 27, 2021, DOT opened at $24.55. On Jun 2, 2021, DOT closed at $25.92. Thus, in the past week, the DOT price has increased by roughly 6%. In the last 24 hours, DOT has traded between $25.67-$27.86.
https://s3.tradingview.com/snapshots/w/WhnJbE6Z.png
Day-Ahead and Tomorrow
Currently, DOT is trading at $27.65. The price has increased from the day’s opening price of $25.92. Thus, the market sentiment seems positive.
The MACD and signal lines are positive. Thus, the overall market momentum is bullish. However, a bearish crossover by the MACD line over the signal line has occurred. Plus, both the lines are closer to the zero line and may turn negative soon. Thus, we can expect a price pullback.
Currently, the RSI indicator is at 43%. It faced rejection at 50% and fell to this level. Thus, selling pressures are high. Hence, the price may start falling soon.
However, the OBV indicator is upward sloping. Thus, buying volumes are higher than selling volumes. High buying activity will exert upward pressure on the DOT price. There is bullish divergence here.
In a nutshell, when we look at all three oscillators together, we can say that a price pullback is on the anvil. However, the price decline may be a corrective action and the price may start moving upwards thereafter. We have to wait and watch if the price pullback is temporary or the beginning of a bearish trend.
DOT Technical Analysis
Currently, the price is above the first Fibonacci pivot resistance level of $27.32. The price may soon fall below it and further below the Fibonacci pivot point of $26.48. Thereafter, we have to wait and watch if the price starts rising.
Presently, the price is above the 23.6% FIB retracement level of $27.34. The price is likely to soon test and fall below it and further below the 38.2% FIB retracement level of $27.02. By day end, if the price retests and breaks out of these levels, then probably the price uptrend is strong and likely to continue tomorrow as well.