One of the longest corrections in the cryptocurrency market took place in the LINK market. More precisely, it is still happening. However, there are notes of its completion or at least suspension. Since May 2021, sellers have managed to lower the LINK price by almost 90%. Thus, the LINK price reached the price level in July 2020. The $7 range was the main liquidity zone during 2020. Buyers stayed above the $7 mark for six months to continue the growth wave. 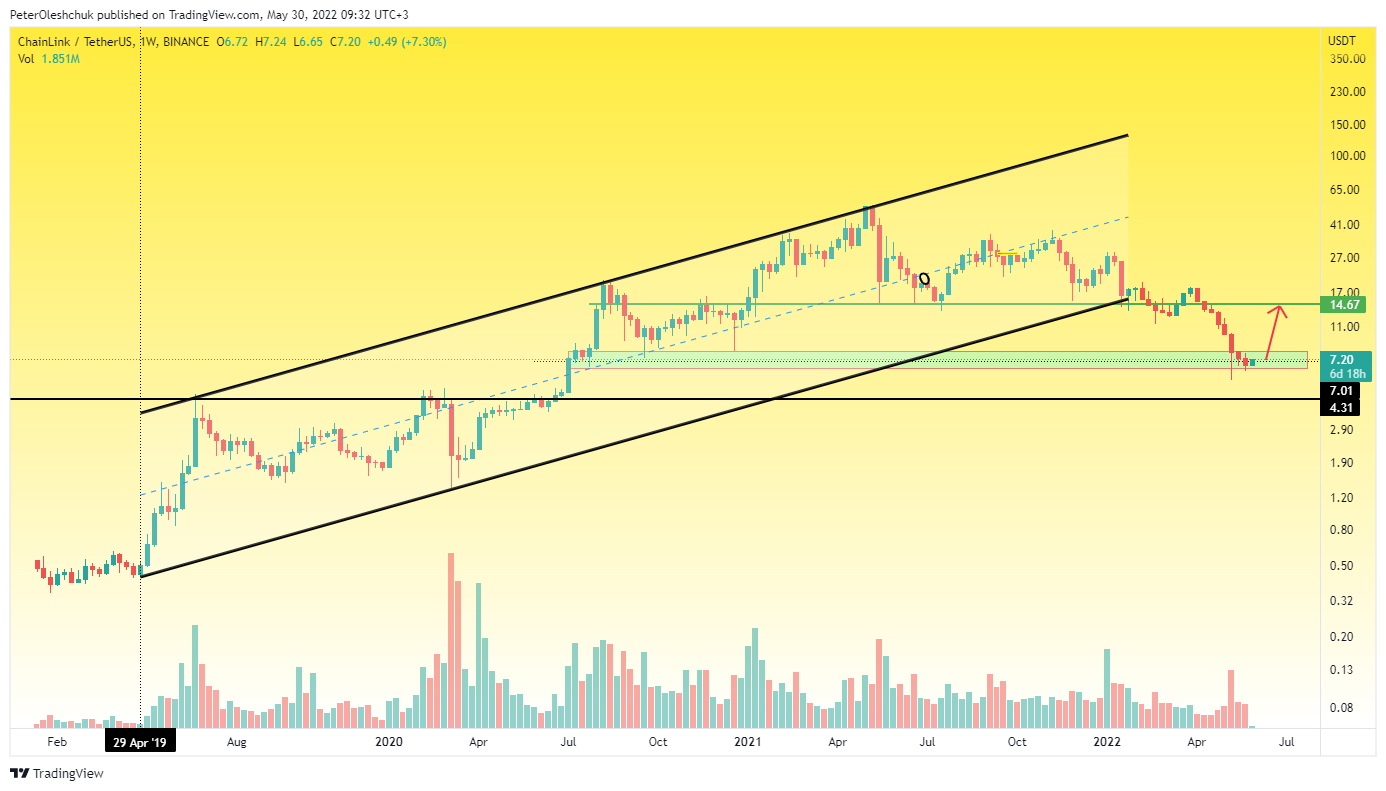 https://www.tradingview.com/x/epl0SvTl/ Therefore, the $50 test is a merit of a successful fight in the $7 range. We have understood the importance of this range. Now about the growth prospects. In the weekly timeframe, we see that sellers has significantly reduced the dynamics of the fall since 9 May. Three weeks of sluggish decline gave buyers a chance to bounce. The weekly candle from 30 May signals a rebound of the LINK price to $14. This target is quite real in the perspective of month two. The most important thing is that this target does not destroy the structure of the LINK fall wave. This growth wave will be the first step of buyers to the global reversal of LINK price. So far, we do not expect uncorrected growth above $14. However, if after the $14 test, buyers will be able to keep the $7.6 range without updating the local low, we will recommend buying LINK in the medium to long term.
Technical Analysis Of LINK On The Daily Timeframe
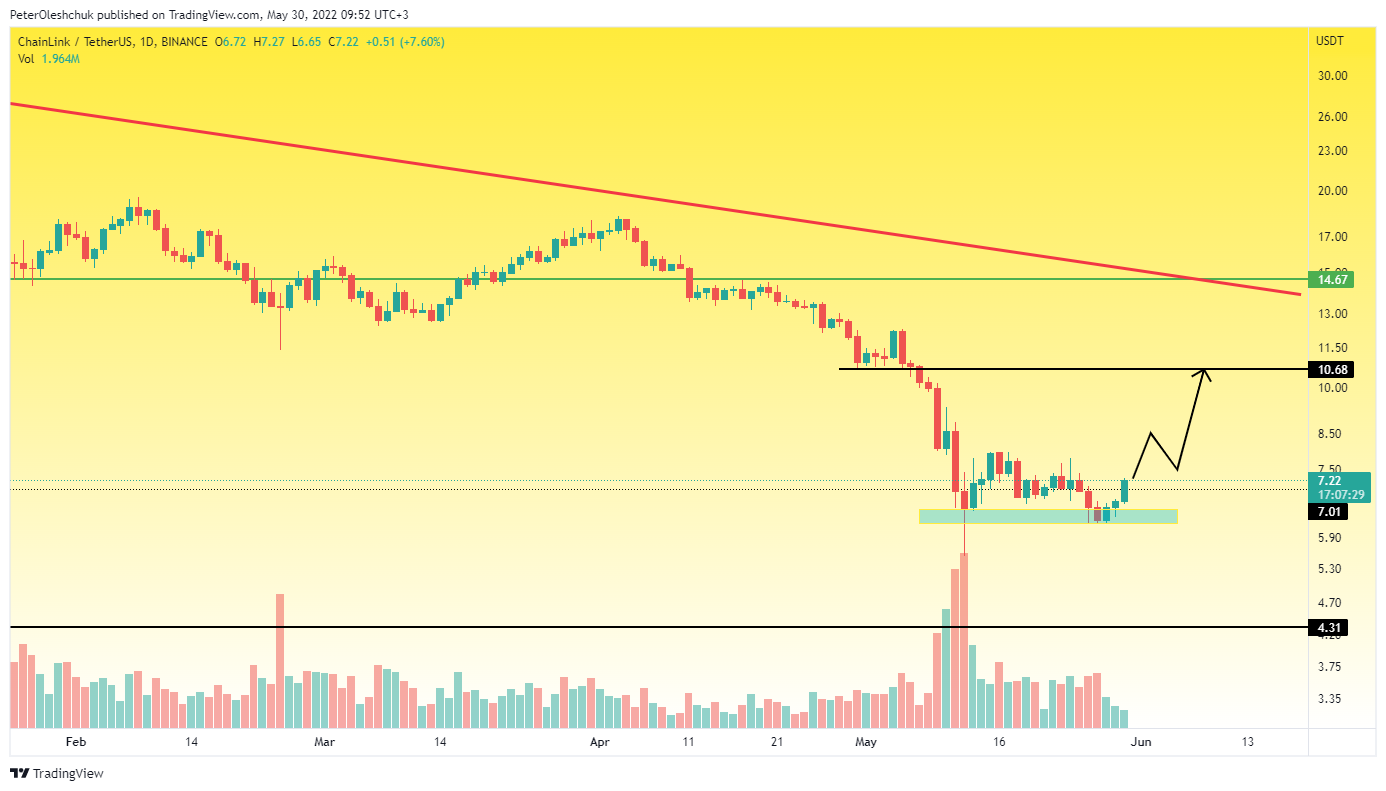 https://www.tradingview.com/x/CDdUEGop/ Analyzing the movement of the LINK price on the daily timeframe, we see "pitfalls" that will push back in time to reach the goal of around $14. Starting from 11 May, the LINK price slowed down significantly in consolidation. Trading volumes have increased in comparison and buyers have prepared a springboard for a rebound. However, the first target of buyers will be the mark of $10. Sellers stopped at this point during 30 April - 5 May due to insufficient forces. Only by accumulating positions in the consolidation sellers were able to break the mark of $10 down. Thus, we believe that the increase in the LINK price to $14 will have at least one correction. And most likely this correction will be from $10. So, if you bought LINK in the range of $6-$7 - it is worth selling part of the investment in the range of $10 so as not to give away potential market returns in the event of a correction.
The LINKBTC Price Has The Prospect Of A 50% Rebound
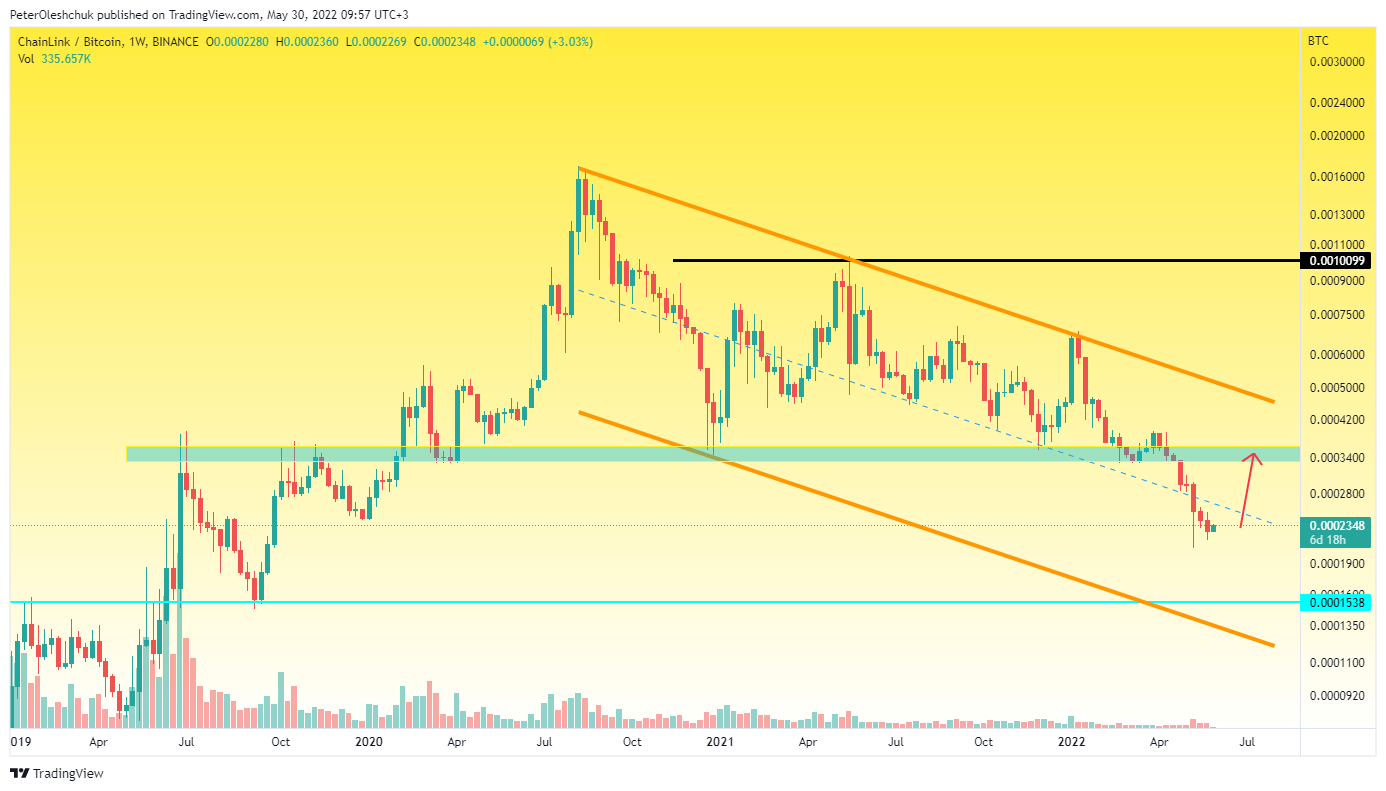 https://www.tradingview.com/x/COh2p6pQ/ The weekly chart of the LINKBTC market does not look the best in the global perspective. Sellers managed to break the important liquidity range of 0.00034 in the last fall wave of January 2022. However, sellers did not have the strength to continue the fall. This is evidenced by a clear price slowdown starting from 9 May. The 0.00034 test will test sellers for strength and allow them to continue the downward trend with the final target of 0.00012. But, the rebound of the LINKBTC price to 0.00034 reaches 50% of the price movement. Quite a good medium-term trade, given the brutal LINKBTC bear market starting in 2020.