Nine trading weeks on the FTT market passed under one melody - the melody of the fall. During this time, the FTT price fell by almost 50%. However, sellers failed to update local lows from May to June 2021. For example, the Bitcoin price updated local lows, although this happened in the form of a false breakdown. Thus, the FTT price has not yet reached even the liquidity zone of $23.6. It is from this liquidity zone that you can invest in low-risk FTT with a global target of $52.77. From this point, a new local fall wave may begin, which is likely to overwhelm the bottom line of the global growth channel. This channel of growth is controlled by buyers from March 2020. 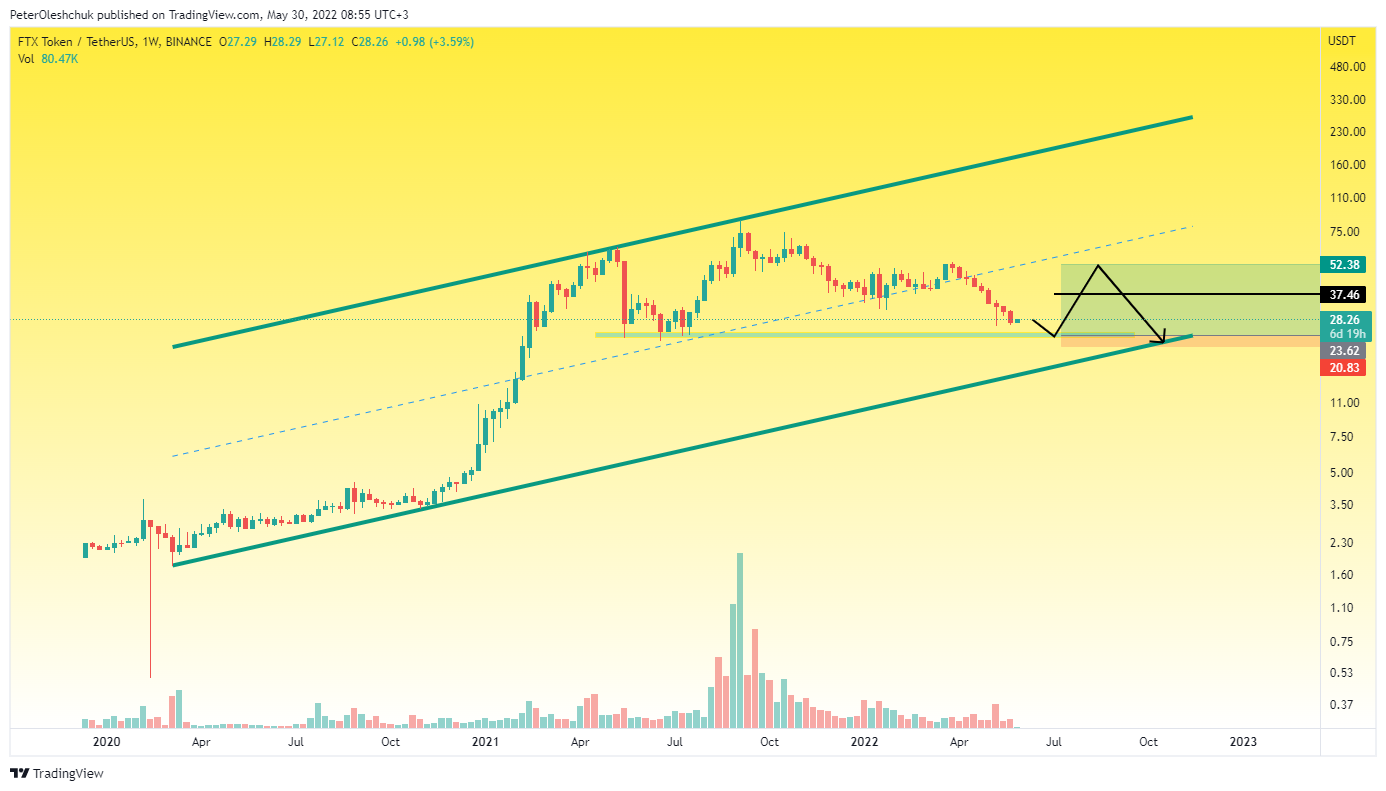 https://www.tradingview.com/x/NUJ8nyzW/ Only after buyers prove their strength and maintain this trend line can we expect the formation of a new growth wave with the historical high update. For now, we do not expect the price to grow above $52.77. Moreover, at around $37.46, we recommend fixing the first part of the profit. At this point is the local fortress of sellers, from which they will have a good chance to continue the fall wave in order to update the local lows from May to June 2021.
Technical Analysis Of FTT On The Daily Timeframe
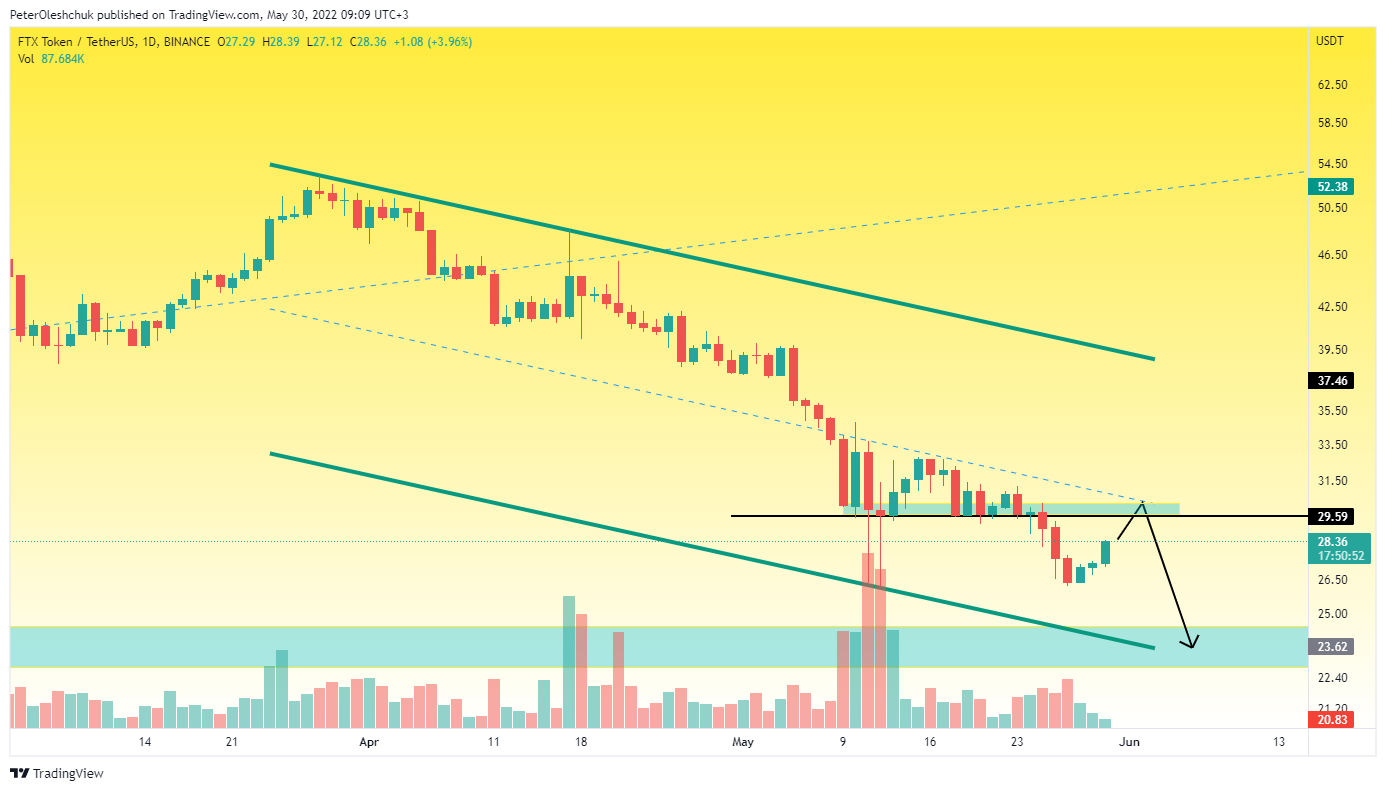 https://www.tradingview.com/x/pEotXHlD/ Analyzing the movement of the FTT price on the daily timeframe, we see that buyers are trying to develop growth. However, the price has not yet emerged from the local downward trend. At the mark of $29.6 is the middle line of the local fall wave. However, this mark is important in a completely different way. During 11-12 May, sellers made great efforts to break this markdown. This operation ended with two false breakdowns of $29.6 at high volumes. However, during the consolidation, sellers managed to push the price below the mark of $29.6. During the growth wave on 28 May, trading volumes were small enough to predict a breakdown of the strong local mark of $29.6 up. Therefore, touching this mark, we expect a continuation of the downward trend with the update of the local low and the test of $23.6. We recommend buying FTT either from the $23.6 mark or after punching and fixing the $29.6 mark at the top.
The FTTBTC Price Is In A Dangerous Pattern
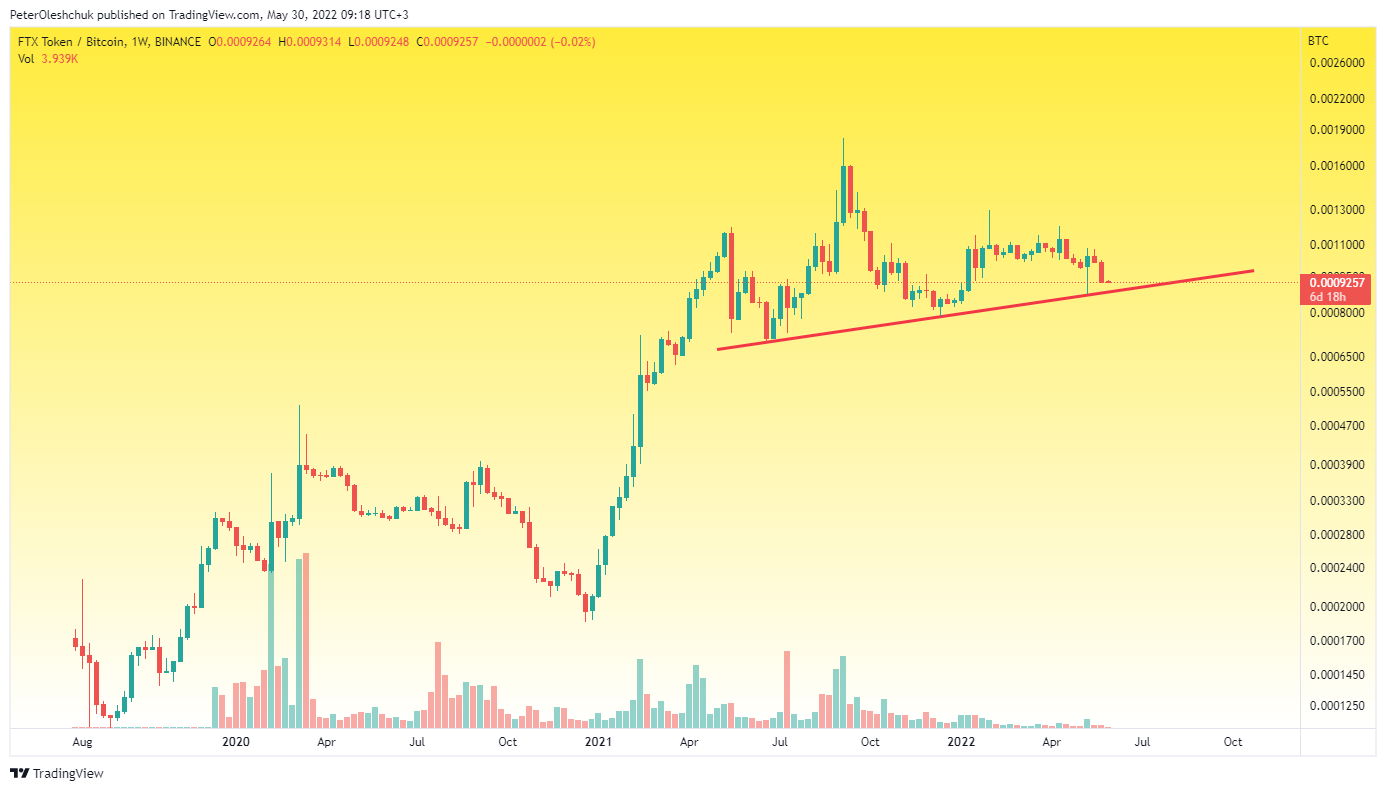 https://www.tradingview.com/x/JTgYw0xx/ However, looking at the weekly timeframe of the FTTBTC price movement, the "pink glasses" are gradually ceasing to show a great future. Starting from June 2021, the FTTBTC price can not jump off the red trend line. This trend line saves the FTTBTC market from the beginning of a protracted correction. If the FTT price falls below 0.00086, you should expect it to fall to 0.00052. However, this process may continue until the end of 2022. After fixing the price below 0.0007, you should get rid of FTT investments and wait for a long and protracted storm in the market.