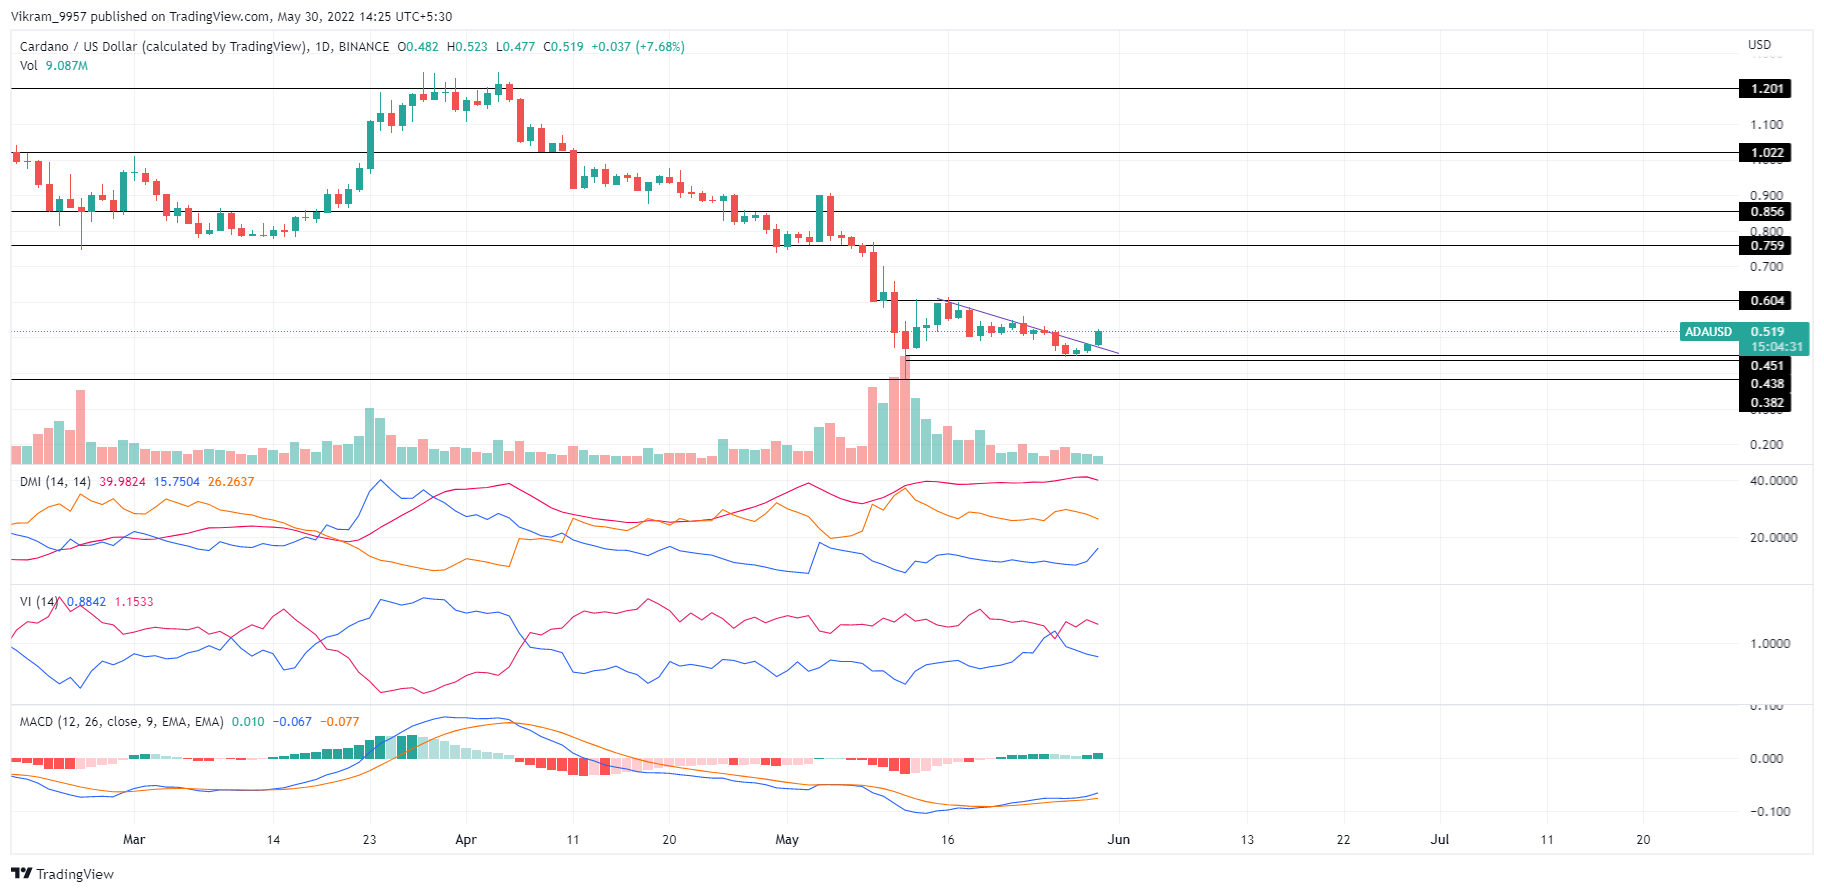
The ADA price chart shows a bullish recovery from the $0.45 mark resulting in the triangle breakout, and the uptrend heads to the $0.60 mark. Key technical points:
- ADA market value increased by 11.68% in the last 24 hours.
- The descending triangle breakout surpasses $0.50.
- The 24-hour trading volume of Cardano is $663 Million, indicating a hike of 68.05%.
Past Performance of ADA
ADA market value shows a bullish reversal from the $0.45 mark after the short-coming downtrend due to the rejection meeting near $0.60. The 15% reversal coming after a 30% downfall last month leads to a descending triangle breakout and forms a triple white soldier pattern.  Source-tradingview
ADA Technical Analysis
The bullish reversal in the ADA prices projects a V-shaped reversal in the daily chart and shows a rounding bottom reversal in shorter timeframes. Nonetheless, the price sustaining above $0.50 will ensure a bull run to the next price action level at $0.60. The MACD indicator displays the fast and slow lines keeping a bullish alignment as they get closer to their zero point. In addition, the bullish histogram speeds up following the resting phase, which indicates the revival of bullish powers. The Vortex indicator shows a bullish crossover event and increases the chances of upside continuation to $0.60. However, the DMI indicator shows a delay in the bullish crossover of DI lines despite a reversal. In a nutshell, ADA technical analysis indicates a possible price jump to the $0.60 mark.
Upcoming Trend
If the breakout rally sustains above the $0.50 mark, ADA prices will reach the upcoming resistance level of $0.60 and will have increased chances of reaching $1. However, a retracement to retest the broken is possible. Resistance Levels: $0.60 and $0.70 Support Levels: $0.50 and $0.45
 cryptoknowmics.com