The STEPN price analysis shows that the bullish momentum intensified in the last 24 hours as bulls have shown tremendous performance. Bulls were already striving to craft an upwards trend line since 27 May 2022, but then the bullish momentum gained strength today as the price levels have been uplifted to the $1.23 mark. A significant amount of recovery in GMT value has been observed after the current increase in price.
GMT/USD 1-day price chart: Bulls march towards $1.38 resistance
The one-day STEPN price analysis is showing signs of an upward trend as more buying activity has taken place in the last 24-hours. The buyers are putting in their efforts to maintain the bullish lead, and the price has been uplifted to the $1.23 level. Although the coin has been maintaining its price levels during the last two weeks, a strong correction on 26 May lowered the price. However, today GMT/USD has gained enormous value amounting to 32 percent for the last 24 hours, which is a major achievement. The price has just crossed the moving average (MA) value, i.e., $1.20.

The volatility is still on a decreasing pattern as the Upper Bollinger band value has come down to $1.70, representing the strongest resistance, whereas the Lower Bollinger band value has been maintained at $0.94, indicating the strongest support level for the GMT price. The Relative Strength Index (RSI) score has also increased up to an index of 40 after the latest uptrend in price.
STEPN price analysis: Recent developments and further technical indications
The four hours STEPN price analysis confirms that the cryptocurrency has been following an uptrend for the past 28 hours as the bulls have been leading the market for a while. Bulls gained momentum at the start of the trading session and rallied extremely high as the price has reached $1.23 at the moment. GMT price has also broken above the resistance present at $1.2 on the 4-hour chart. The moving average value in the four hours price chart has increased up to the $1.06 mark.
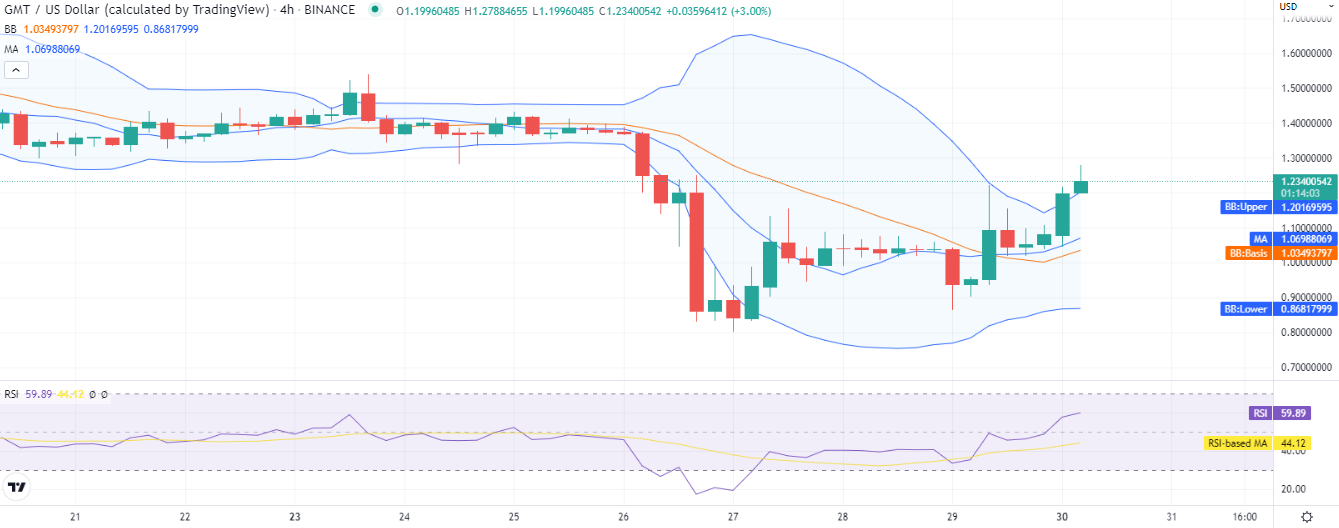
A crossover between SMA 20 and SMA 50 curves was also observed earlier as the bullish trend is getting stronger. The Bollinger Bands Indicator is now showing the following values; the upper Bollinger band value is $1.20, whereas the lower Bollinger band value is $0.86, and the price is trading above the upper band. The RSI score has increased up to index 59 in the upper half of the neutral zone.
STEPN price analysis conclusion
The daily and hourly STEPN price analysis is supporting the buyers today as a strong bullish price movement is taking place. The price is on its way to recovery and has increased up to $1.23 because of the upward trend. If the bulls remain persistent, further improvement in the coin value is to follow in the approaching week. However, a correction might also be on its way, as the technical indications suggest.
Disclaimer. The information provided is not trading advice. Cryptopolitan.com holds no liability for any investments made based on the information provided on this page. We strongly recommend independent research and/or consultation with a qualified professional before making any investment decisions.