Cardano (ADA) recently fell below its support line of $0.50 as seen at press time. Just like Bitcoin, major altcoins too have either consolidated or fallen on their charts. On the longer time frame, Cardano (ADA) continued to display bearish thesis.
For the shorter time frame, ADA was hinting at a possible price reversal on charts. Over the last 24 hours, ADA increased by 1.7% and in the last week, the coin brought home a double digit loss. The bulls have faded out as buying strength continued to remain bleak at the time of writing.
At the moment, $0.50 has been acting as the coin’s immediate resistance mark. Immediate support levels for the coin ranged between the $0.44 and $0.40 price marks respectively. If broader market recovers along with a consistent buying strength, there could be hopes of a price reversal for Cardano (ADA).
Cardano Price Analysis: One Day Chart
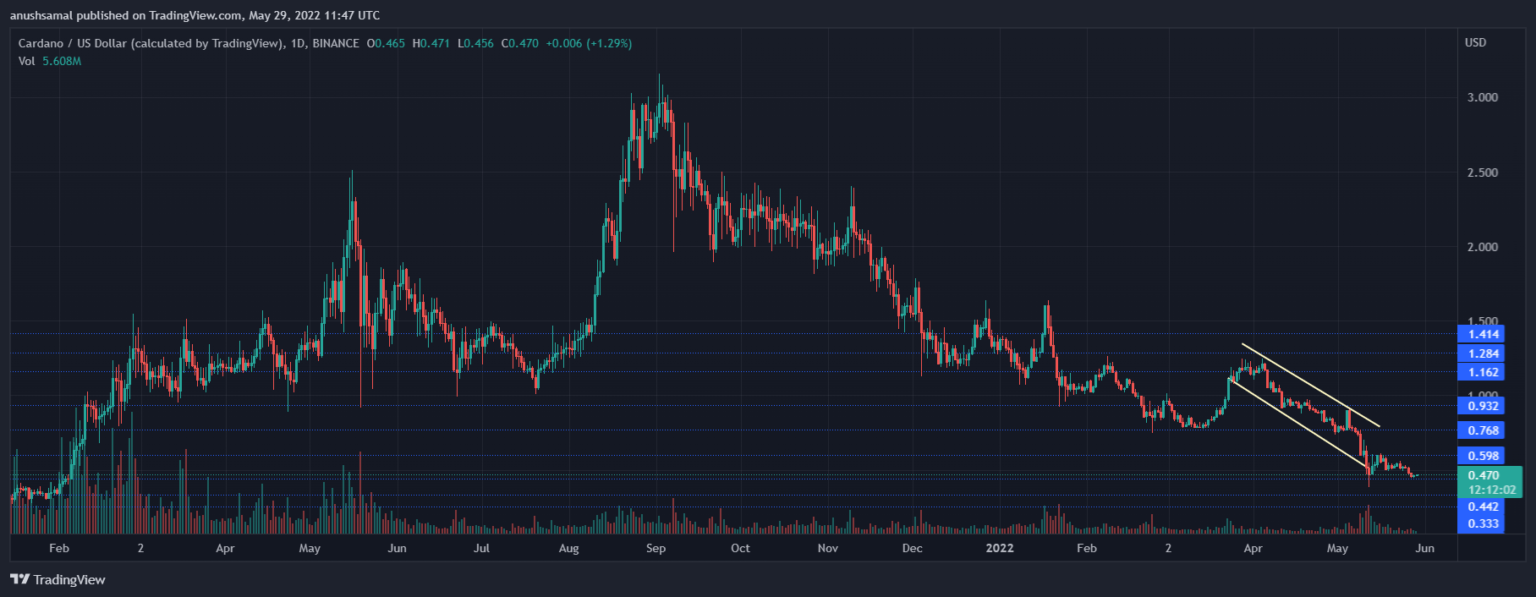
ADA was trading at $0.47 at the time of writing. Ever since April the coin formed a descending channel which reflected bearishness on the chart. Recently, ADA broke out of the descending channel as it fell below the $0.50 price mark.
At the moment $0.50 is acting as the nearest price ceiling for the coin. In case Cardano is able to break past the $0,50 price mark, the coin could trade near $0.58. A fall below the $0.47 price level will cause ADA to hover between $0.44 and $0.40.
A fall beneath which might make ADA touch its over an year low price level. Volume of the coin dipped considerably signifying that bears were still in charge.
Technical Analysis
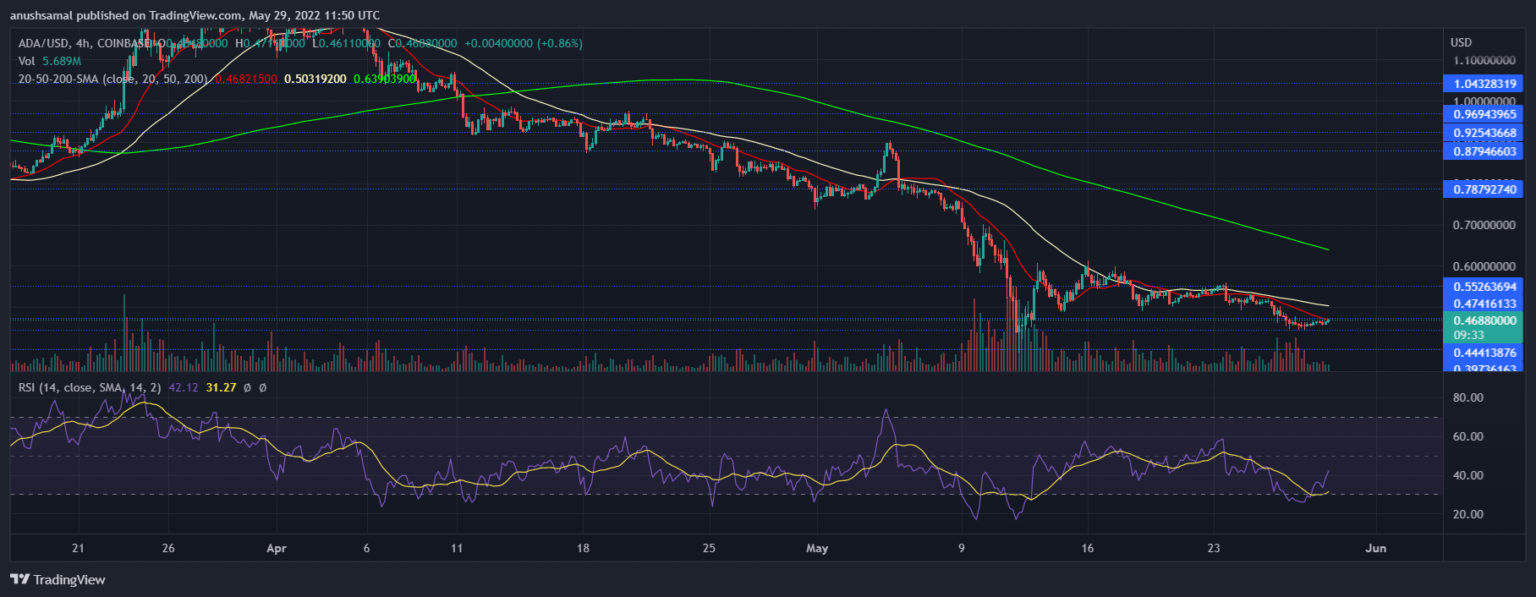
Cardano showed signs of price reversal on the four hour chart. The price of the altcoin was attempting to rise above the 20-SMA line. At the moment however, the sellers were still in charge of the price momentum.
The Relative Strength Index registered an uptick which meant that the price was optimistic on the chart. Buyers were coming back in the market and an increased demand could push the asset above the 20-SMA.
Increased demand will make ADA trade near the $0.58 price level and then the coin could attempt to touch the $0.70 price level.
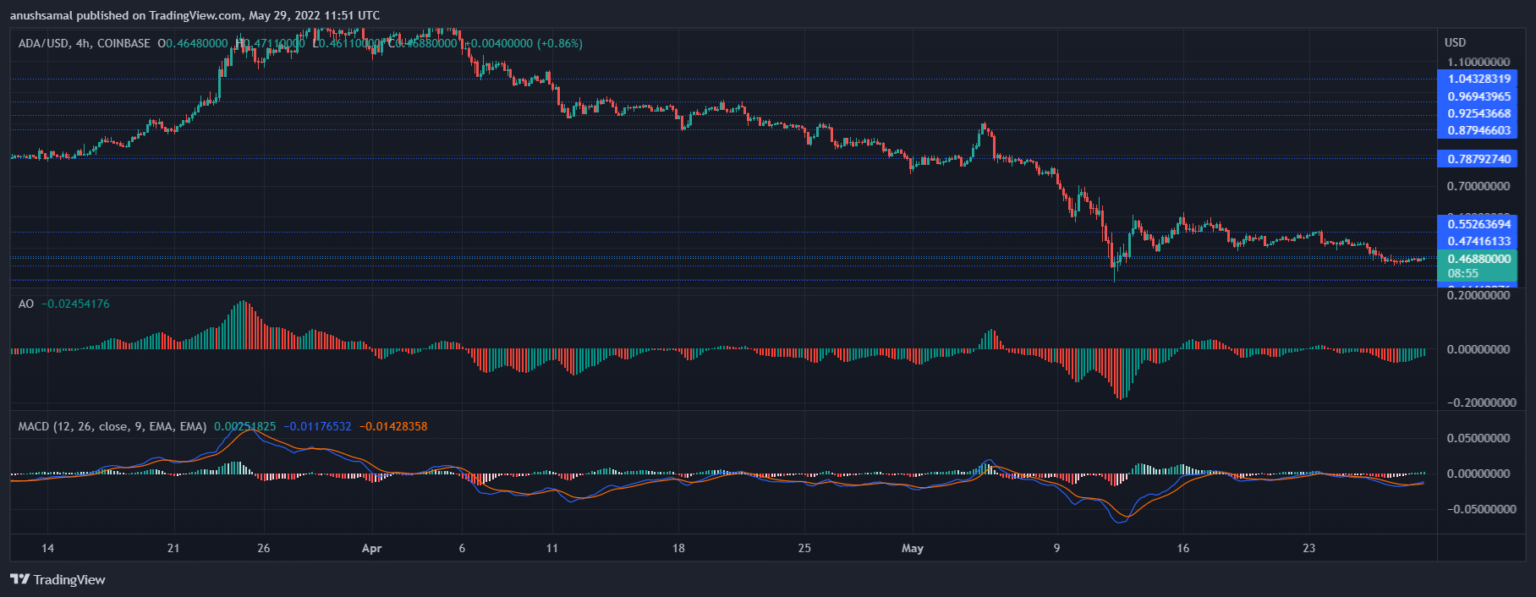
ADA’s Awesome Oscillator displayed green histograms and this meant a change in price momentum. AO also depicted a buy signal as the green histograms were a sign of the same.
Moving Average Convergence Divergence underwent a bullish crossover and flashed green histograms.
Green histograms meant that over the upcoming trading sessions, the coin could attempt to rise on its charts.