Solana price analysis is showing a bullish trend for the coin. Prices have managed to push higher, with trading currently above the $42.78 level. There is some resistance around the $44.66 area, which could cap any further upside potential in the short term. However, if prices can break above this level, they could test higher levels such as $46.50 and $48.00. On the downside, there is support around the $41.21 level, which could provide some stability in the event of a pullback.
The altcoin has seen some strong buying pressure as of late and looks poised to continue its upward momentum in the medium term. Solana prices have been hovering around the $40.00 level for the past few days, however, they have managed to break out to the upside and are currently trading at $42.78.
Solana price action on a 1-day price chart: SOL/USD trades above $42.78
Solana price analysis on the 1-day price chart shows that SOL/USD pair has been trading with a positive bias. The pair has formed higher lows and higher highs which is a bullish sign the price action recently had a breakout above the ascending triangle pattern that had developed over the past 24 -hours which is a bullish sign.
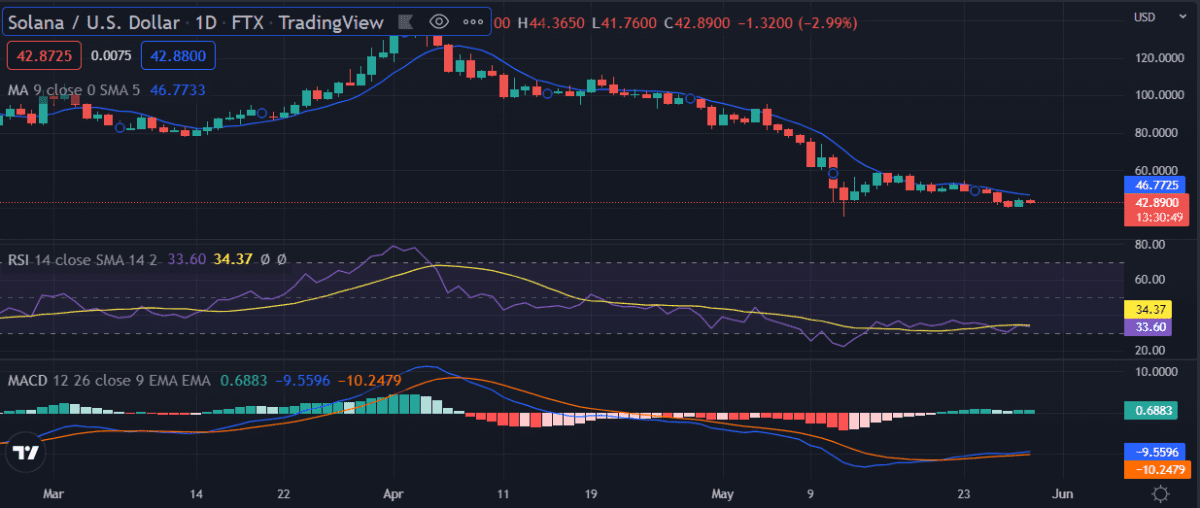
The volume market has seen a significant decrease over the past 24-hours which is currently sitting at $1,242,914,898. while the market cap is $14,518,081,387 in the last 24 hours. The MACD indicator is currently in the bullish zone as the signal line is above the MACD line, which indicates that the bulls have the upper hand.
The RSI indicator on a 1-day timeframe is showing that prices are trading in overbought territory as it is currently at 70.65. This indicates that there could be some consolidation in prices in the near term as the market could take a breather after the recent rally.MA 5O and MA 200 are also above the price action which indicates that the bulls are in control of the market.
Solana price analysis on a 4-hour price chart: Bulls have won the race after a short-term price battle
On the 4-hour price chart, Solana’s price analysis reveals that the coin had started to recover after the previous loss. The SOL/USD is currently trading at $42.78 and is facing immediate resistance at $44.64 and support for SOL/USD is present at $41.21.
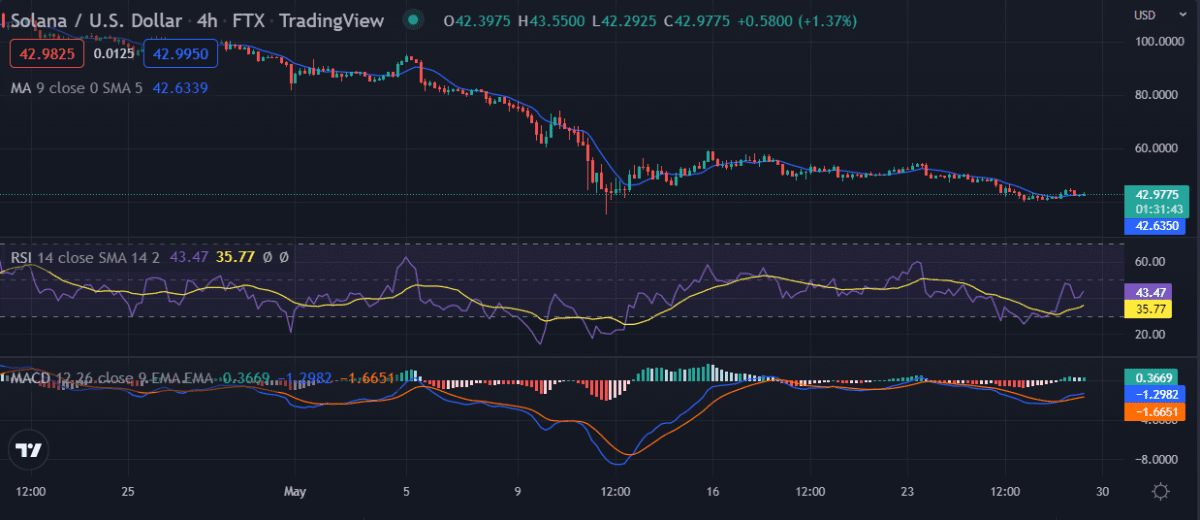
The Relative Strength Index for SOL is currently at 68.21, which indicates that prices are trading in overbought territory and might see some consolidation in the near term. The Moving Average Convergence Divergence indicator on the 4-hour timeframe is currently in the bullish zone as the signal line is above the MACD line, which indicates that the bulls have an upper hand in the market.MA 5O and MA 200 are indicating that the market is in a bullish trend as they are both above the price action.
Solana price analysis conclusion
Solana price analysis shows that the coin has seen a strong rally in recent days and looks poised to continue its uptrend in the near term. Prices have found some support around the $41.21 level, which could provide some stability in the event of a pullback. The bulls are currently in control of the market as prices have been trading above the moving averages. However, investors should exercise caution as prices may correct lower in the event of a sudden sell-off.
Disclaimer. The information provided is not trading advice. Cryptopolitan.com holds no liability for any investments made based on the information provided on this page. We strongly recommend independent research and/or consultation with a qualified professional before making any investment decisions