Tezos price analysis for today shows that the XTZ/USD pair has recovered from a low of $1.77 and is currently fluctuating at around $1.94. The market had a bullish run yesterday which saw the price go up to $2.02 but it has since pulled back. The bulls are currently facing resistance at the $1.95 level and the bears are trying to push the price down.

The XTZ/USD pair is currently trading at a critical junction and a breakout from either side of the range could set the tone for the next move. The market cap for the Tezos price is currently sitting at $ 1,743,519,892. The trading volume has decreased over the last 24 hours to retrace to $88,370,851 Therefore, the bulls need to be careful as a bearish move could invalidate the bullish trend, the Tezos price is currently in a breakout zone and a move in either direction could set the tone for the next move.
Tezos price analysis on a 1-day price chart: XTZ prices look to break above the $1.95 resistance
On the 1-day chart, we can see that the Tezos prices analysis shows an uptrend for the last 24-hour period. The prices have risen from a low of $1.77 to the current high of $1.94. The market is currently testing the $1.95 resistance level and a breakout above this level could see the prices move higher toward the $2.02 level.
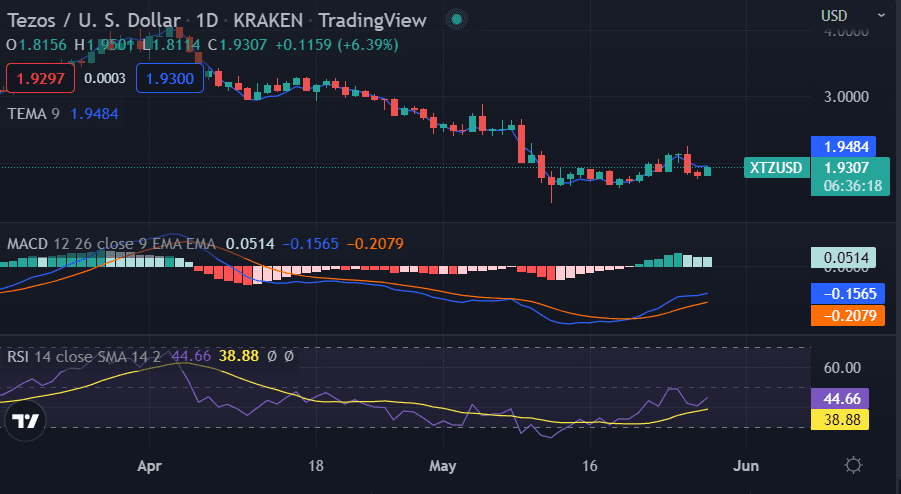
The Moving Average Convergence Divergence indicator is currently in bullish territory with the MACD line above the signal line. The Relative Strength Index is currently at 60 levels and is slowly moving towards the overbought region, which indicates that the bulls are in control of the market. The EMA ribbon is currently bullish and is providing support to the prices.
Tezos price analysis on a 4-hour price chart: Recent developments and further technical indications
On the 4-hour chart, Tezos prices analysis shows a bullish trend for the last 4-hours. The market had found support at the $1.77 level and from there, the prices moved higher to test the $1.95 resistance level. The prices are trading along with the ascending channel and a breakout from the current range could set the tone for the next move.
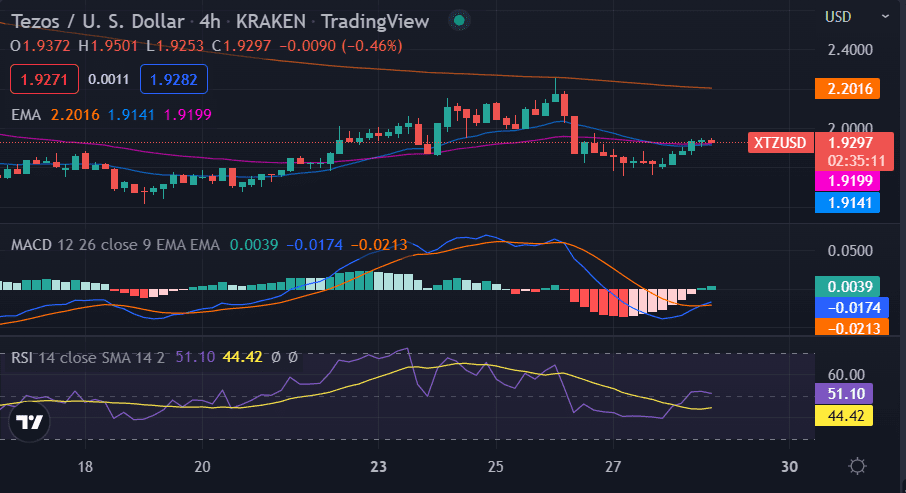
The MACD indicator is below the zero line and is currently in bearish territory. The RSI indicator is moving below the 50 levels, which indicates that the bears are in control of the market. The EMA ribbon is currently below the prices and is providing support to the prices.
Tezos price analysis: Conclusion
In conclusion, Tezos price analysis shows a slightly bullish trend in the market. The digital asset is currently trading at a critical junction and a breakout from either side of the range could set the tone for the next move. The bulls need to be careful as a bearish move could invalidate the bullish trend. However, investors could look to buy on dips as the overall trend is bullish.
Disclaimer. The information provided is not trading advice. Cryptopolitan.com holds no liability for any investments made based on the information provided on this page. We strongly recommend independent research and/or consultation with a qualified professional before making any investment decisions.