Chainlink price analysis, the decentralized oracle network, is currently trading at $6.47 after a slight price dip of around 1 percent over the past 24 hours. The coin had earlier surged to as high as $6.65 but lost momentum and fell back below the $6.47-level. Support for Chainlink is present at $6.24, and the resistance for the coin is at $6.54.
Chainlink’s trading volume has declined but is still above average whereby it is currently sitting at $331,086,170 while the market capitalization has declined by 0.17 percent over the last few hours. Chainlink’s downfall may be attributed to the recent market crash which has affected the entire cryptocurrency market. The overall market capitalization has declined by over $100 billion in the past 24 hours, and Chainlink’s price has followed suit, and it is currently sitting at $3,023,109,388.
Chainlink price action on a 1-day price chart: Bearish spell sinks LINK prices to lows of $6.47
The 1-day chart for Chainlink price analysis shows the bearish trend appears to be intact as prices have dipped below the $6.47-level. The trendline has been respected as prices make their way towards the $6.24-support level. Looking at the 1-day price chart, we can see that the LINK/USD pair has been in a bearish trend for several weeks now, with the price dropping from $8.50 to $6.47. The current market conditions appear to be bearish.
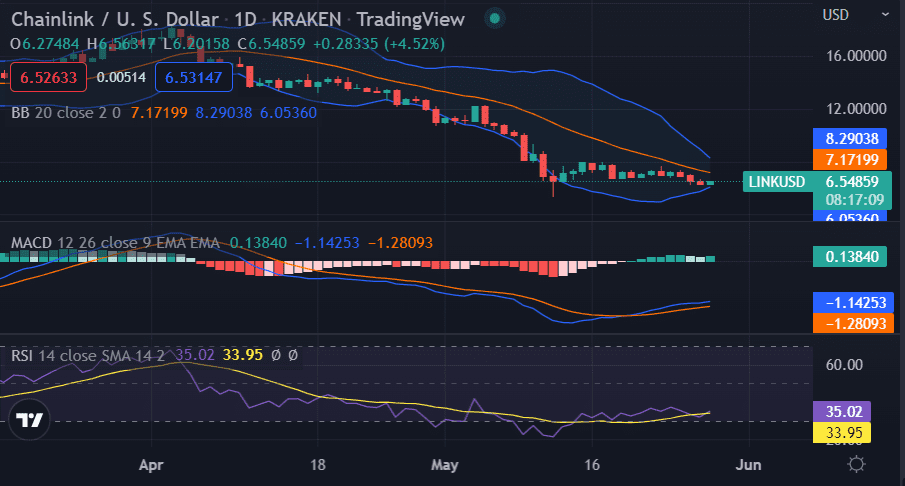
The RSI indicator is currently oversold and may see a slight rebound in prices as the indicator moves away from the 30-level. The MACD indicator is also bearish as the signal line crosses below the MACD line. The Bollinger Band is currently in a squeeze, which may lead to a breakout in either direction
The 4-hour chart for LINK/USD: Further price decline likely
The 4-hour Chainlink price analysis shows that the price is currently trading below the $6.47-level and may fall to as low as $6.24 in the near term. The price is currently being resisted at the $6.54-level, and a break above this level may see prices rebound to $6.65. The technical indicators are currently bearish as the Relative Strength Index is below the 50-level, which indicates that the market is currently in a bearish phase.
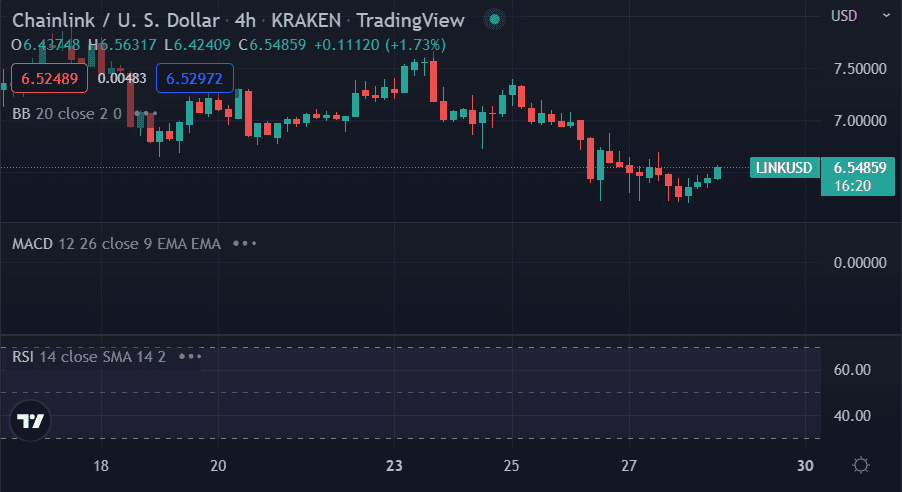
The moving average convergence divergence(MACD) indicator shows that the bearish trend is still in play as the MACD line (blue) moves below the signal line. The Bollinger Bands are below the candlesticks, which indicates that prices may fall further in the near term. The investors looking at a 4-hour Chainlink price chart should wait for a breakout or a rebound before making their investment decisions.
Chainlink price analysis conclusion
Chainlink price analysis shows that the coin price covering range downwards and is trading at the $6.47 mark. Chances are there for further decrease as the price has decreased during the last hours. We expect the LINK/USD to float above the $6.24-support level and may rebound to $6.65 in the near term. The technical indicators are currently bearish, and a breakout or a rebound is awaited before making any investment decisions.
Disclaimer. The information provided is not trading advice. Cryptopolitan.com holds no liability for any investments made based on the information provided on this page. We strongly recommend independent research and/or consultation with a qualified professional before making any investment decisions.