Solana price analysis indicates SOL prices opened the daily chart trading as low as $40.96 and continue to trade in a bearish trend. After the recent market-wide sell-off, the cryptocurrency has not been able to find any buyers at higher levels and has slipped below $45.0.The bears have taken control of the price action and are pushing prices lower. The next level of support is present at $35.0 and a move below this level could see prices testing the $30.0 level.
Solana price analysis: Technical analysis
Solana price analysis indicates SOL prices have been trading between a range of $40.27 to $44.73 and the prices have declined by 8 percent in the past 24 hours. The digital asset has a market capitalization of $13,855,860,609.92 while the total trading volume sits at $2.3 billion. The digital asset has a market dominance of1.18 percent as the digital asset ranks position 9 overall.
The moving averages are all trending lower and the 20-day moving average has crossed below the 50-day moving average, which is a bearish sign. The MACD indicator is also giving oversold readings, which suggests that the bulls might make a comeback soon. The RSI indicator is also in the oversold territory and a move back above 50 could see prices retesting the $45.0 level.
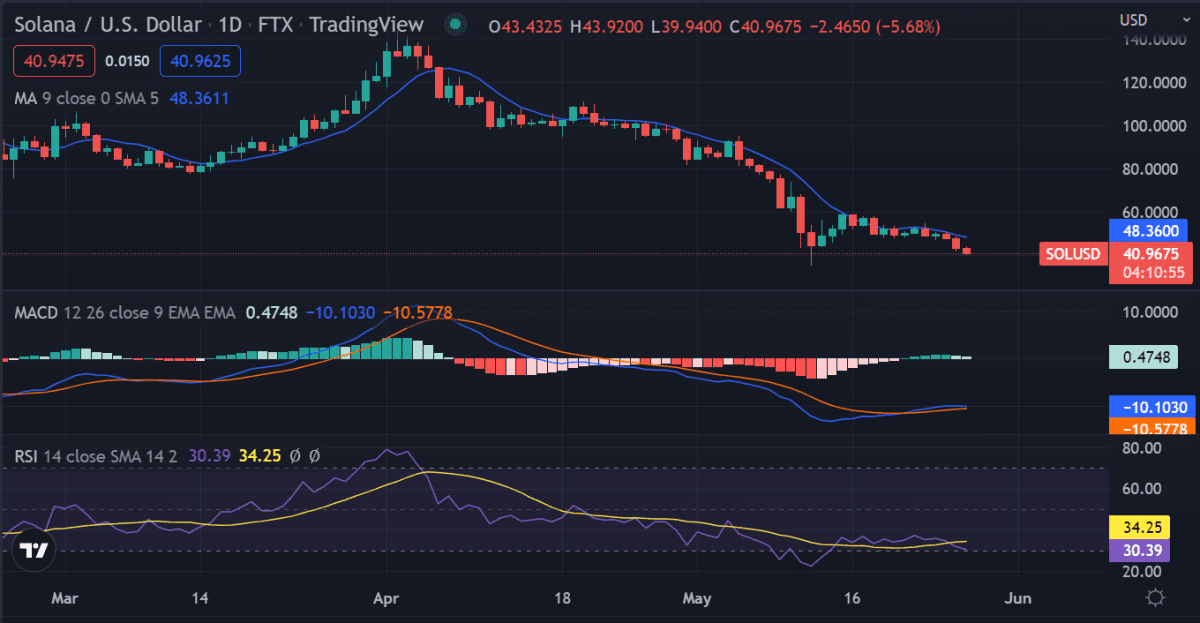
The digital asset will need to find support at $35.0 and move back above $45.0 to signal a change in trend. The Bolinger bands are currently in a bearish mode as prices have slipped below the middle line. A move back above the middle line could see prices testing the $45.0 level. The downside target for Solana remains at $30.0 and a move below this level could see prices declining to $25.0 in the near term.
Solana price analysis on a 4-hour price chart: SOL prices decline to $40.96
The 4-hour chart shows that the prices have declined to $40.96 after a bearish spell. The market has faced a strong sell-off and the prices have not been able to find any buyers at higher levels. The MACD indicator is bearish and the RSI indicator is also in the oversold territory, which suggests that the sell-off might continue in the near term. The digital asset will need to find support at $35.0 and move back above $45.0 to signal a change in trend. The next level of resistance is present at $50.0 and a move above this level could see prices testing the $55.0 level.
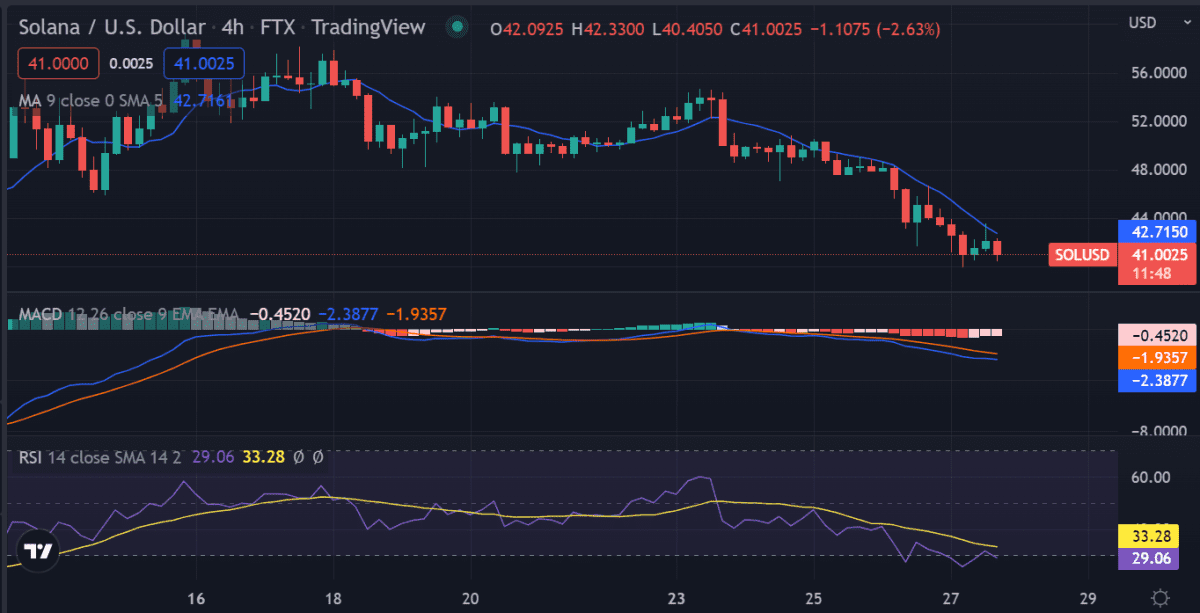
The 50-day moving average is currently at $41.07 and the 200-day moving average is at $40.09, which indicates that the digital asset is in a long-term bearish trend. The digital asset will need to move back above the 200-day moving average to signal a change in trend.
Solana price analysis conclusion
Solana price analysis shows that the digital asset has slipped to $40.96 after a bearish spell. The market has faced a strong sell-off and the prices have not been able to find any buyers at higher levels. The digital asset will need to find support at $35.0 and move back above $45.0 to signal a change in the trend. The next level of resistance is present at $50.0 and a move above this level could see prices testing the $55.0 level.
Disclaimer. The information provided is not trading advice. Cryptopolitan.com holds no liability for any investments made based on the information provided on this page. We strongly recommend independent research and/or consultation with a qualified professional before making any investment decisions.