An important human skill is to complete a process that you like in time. This is clearly shown by the weekly timeframe of the SHIB cryptocurrency. Only 5 trading weeks are needed for complete happiness and prosperity. Or a bunch of months of regret for over-investment in SHIB. Having grown by 700% in 5 weeks, the SHIB price has again reached the range from which it began its majestic growth trend. 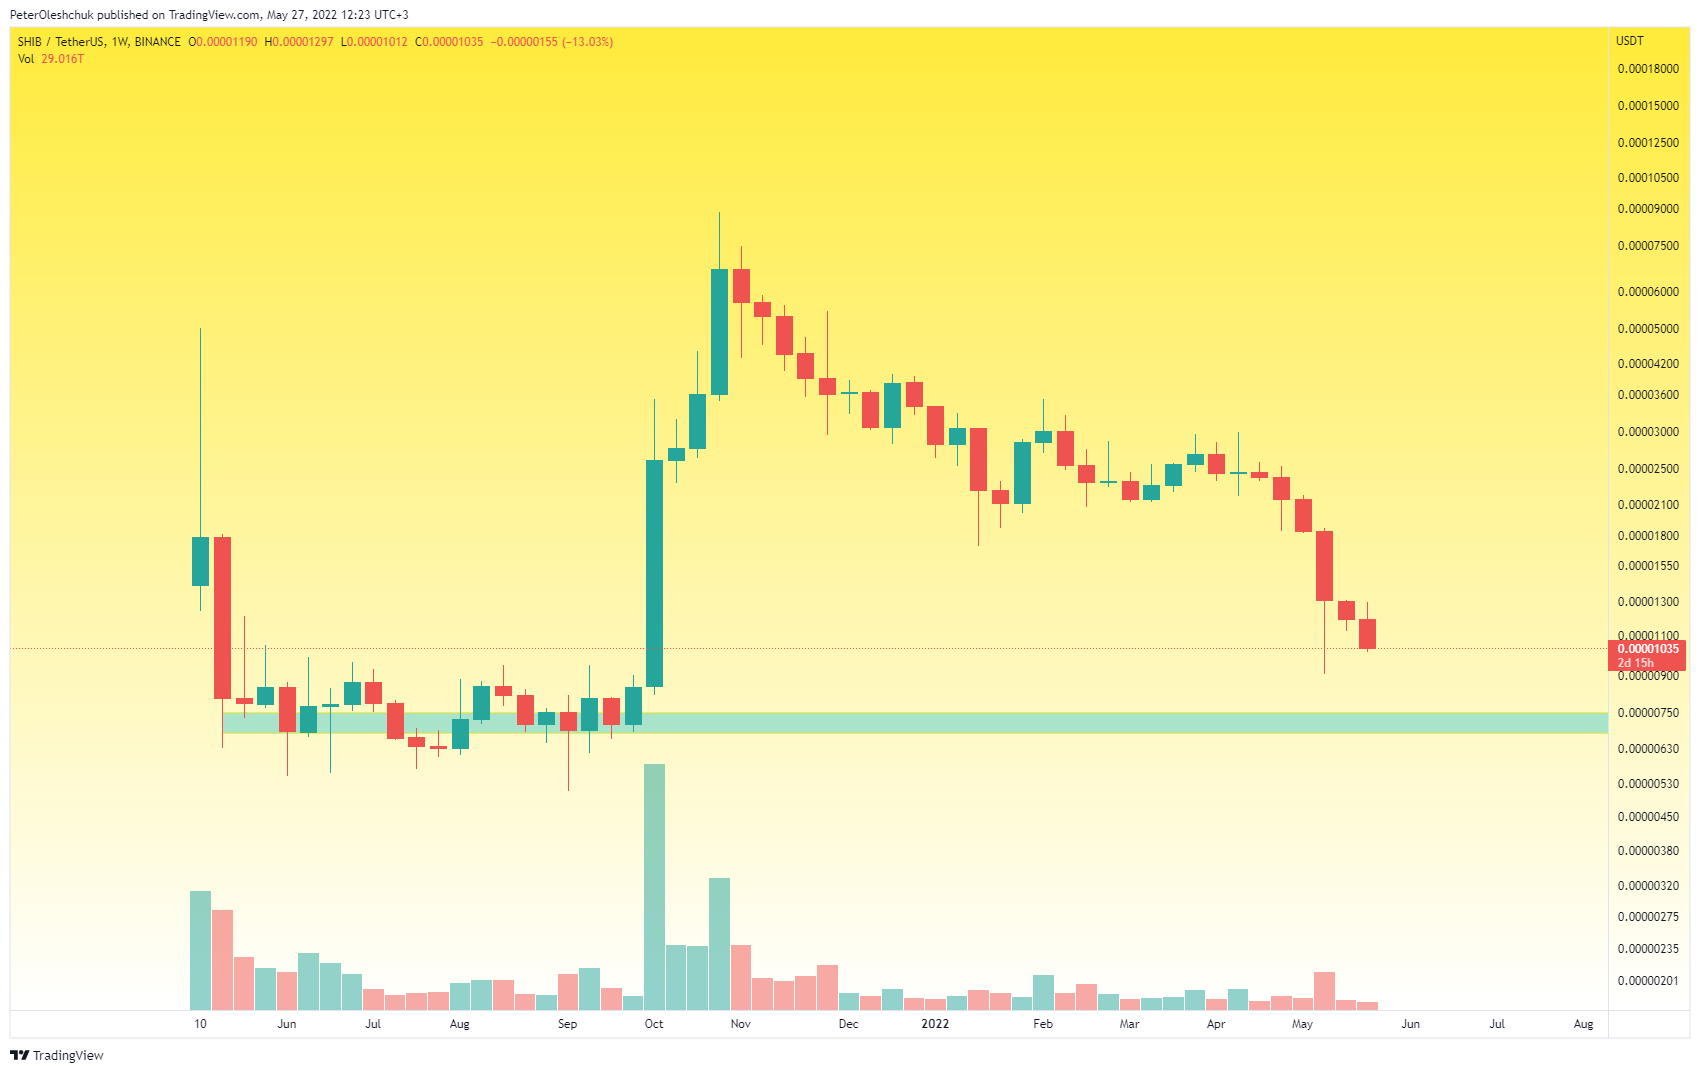 https://www.tradingview.com/x/sRiZN3x5/ If you plan to buy SHIB then not earlier than in the range of 0.00000075. It is at this point that there is a high probability that the SHIB market is trading and buyers will finally be able to slow down the strong and protracted downward trend. The first target, in this case, is relatively close - 0.00000098. However, it is worth forgetting for a while about the possibility of SHIB still firing with the same force. At least buyers should form a consolidation on a weekly timeframe, within which you can successfully trade 40-50% of the SHIB price movement.
SHIB Technical Analysis On The Daily Timeframe
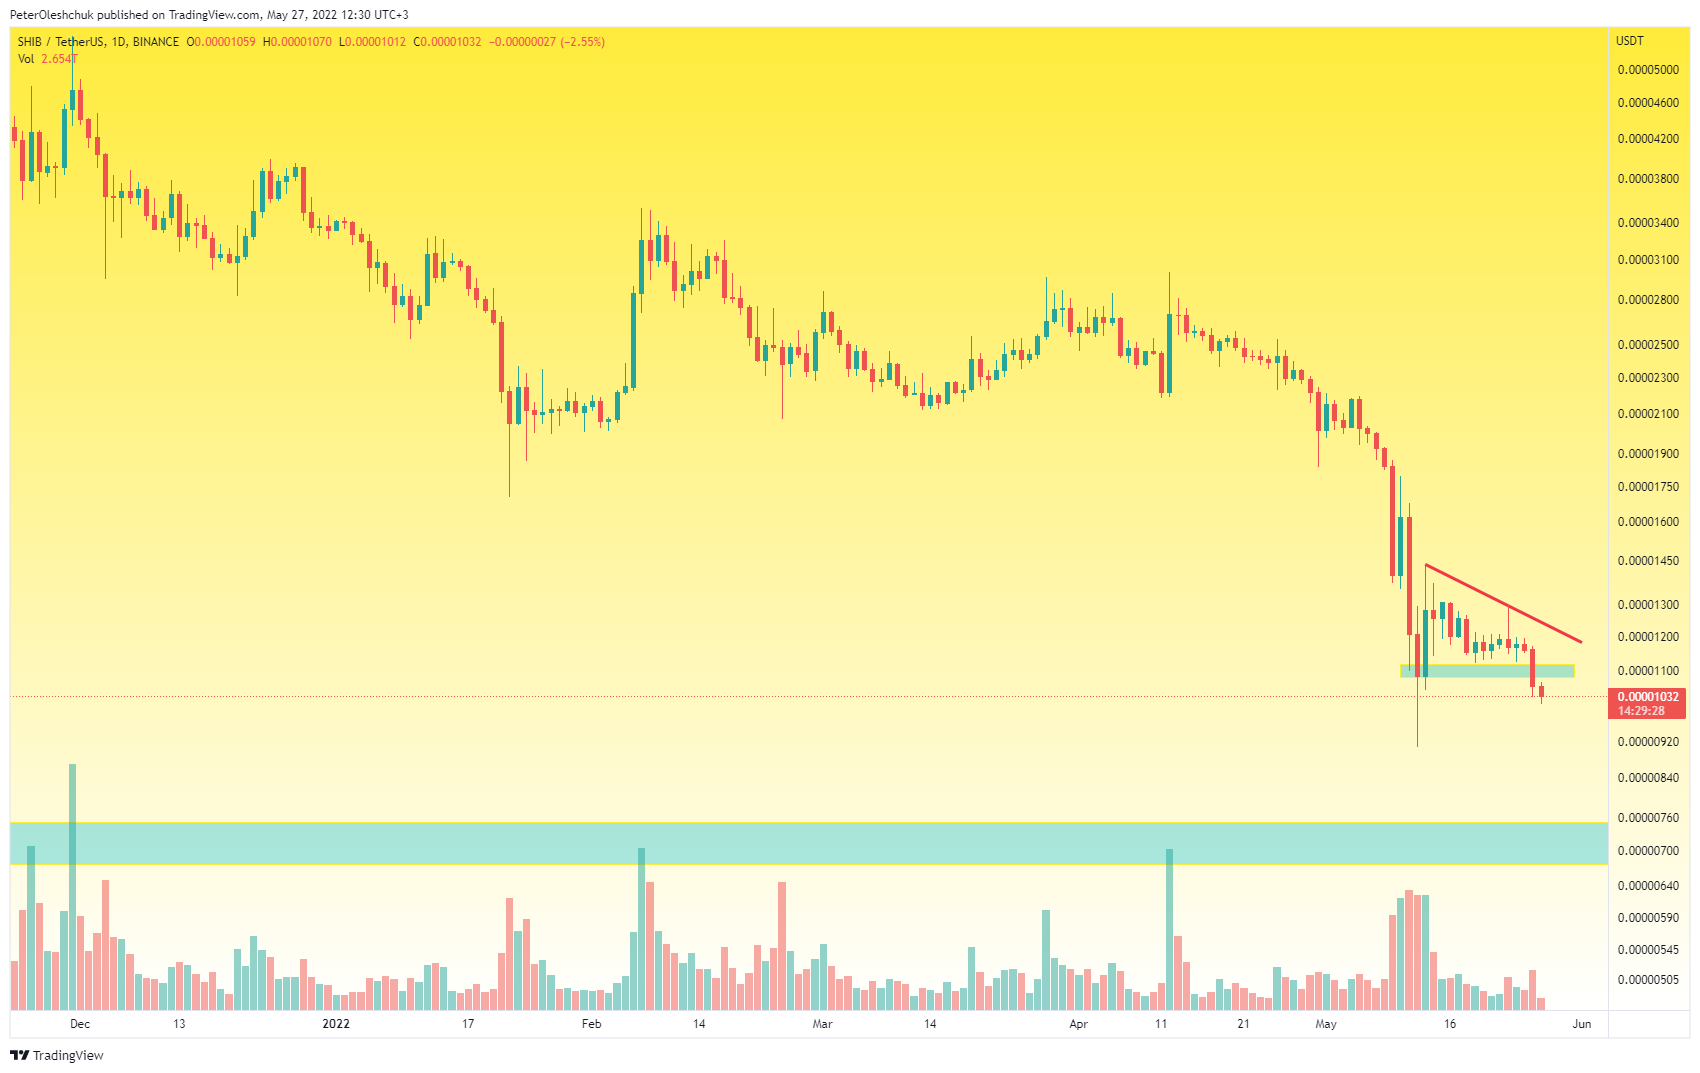 https://www.tradingview.com/x/7Z16v12y/ Analyzing the movement of SHIB price on the daily timeframe, we can say that buyers could not keep the local initiative, which they had before 25 May. The fact is that the local mark 0.000001 was lost by buyers. And lost without much struggle - in fact loyal. The mark 0.000001 was important during 11-12 May. It is in this range that buyers have kept and significantly slowed down the coin price fall. Loss of control of this mark without volumes indicates the lack of interest of a large buyer. Thus, we should expect the local low to be updated and the downward trend to continue. We do not recommend buying SHIB until the price is fixed above 0.000001. Reducing the SHIB price at high volumes can give investors hope and the opportunity to increase their position with little risk. Though, these are still hypothetical guesses, which are not visible on the chart.
SHIBUSDT Price Offers Medium-Term Shorts
 https://www.tradingview.com/x/2YYz9WF2/ The 4-hour SHIB timeframe confirms the total weakness of buyers and demonstrates the liquidity zone from which you can open a short position. In the range of 0.00000115 buyers on 11-12 May with great effort took control, which was successfully maintained for 2 weeks. But, the loss of control in this range without volume indicates the complete dominance of sellers in the market, even after a rollback wave of decline. The angle of the SHIB price fall has changed and we plan to rebound to the mark of 0.00000115. In this case, to open a short position with a ratio of potential profit to a loss of 7: 1 in our opinion would be a good option.