Polkadot price analysis reveals a relatively positive approach today; the price has gained most of its lost value. In the last few days, the price of DOT has received much negative attention and has declined to a significant degree. On May 26, 2022, the price suddenly crashed and went from $9.98 to $8.92. However, the price started to gain positive momentum on the same day and regained a value of as much as $9.47. Today, on May 27, 2022, the price has seen massive highs and has reached an all-day high of $9.83. However, the currency price of the cryptocurrency remains around $9.68.
Polkadot trades at $9.68 right now; Polkadot is up 6.00% in the last 24 hours, with a trading volume of $1,308,727,588 and a live market cap of $9,599,015,530. Polkadot ranks at #11 in the cryptocurrency, with a circulating supply of 987,579,315 DOT coins.
DOT/USD 4-hour price analysis: Recent updates
Polkadot price analysis reveals the market volatility to follow an uncertain opening movement, which causes the DOT prices to become more susceptible to volatile change. As a result, the upper limit of the Bollinger’s band is present at $10.48, acting as the strongest resistance for DOT. Conversely, the lower limit of the Bollinger’s band is present at $8.87, which represents the strongest support of DOT.
The DOT/USD crosses over the Moving Average curve indicating a bullish movement in the market. The price appears to move upwards with a strong possibility of soon reversing the market to a bullish trend.
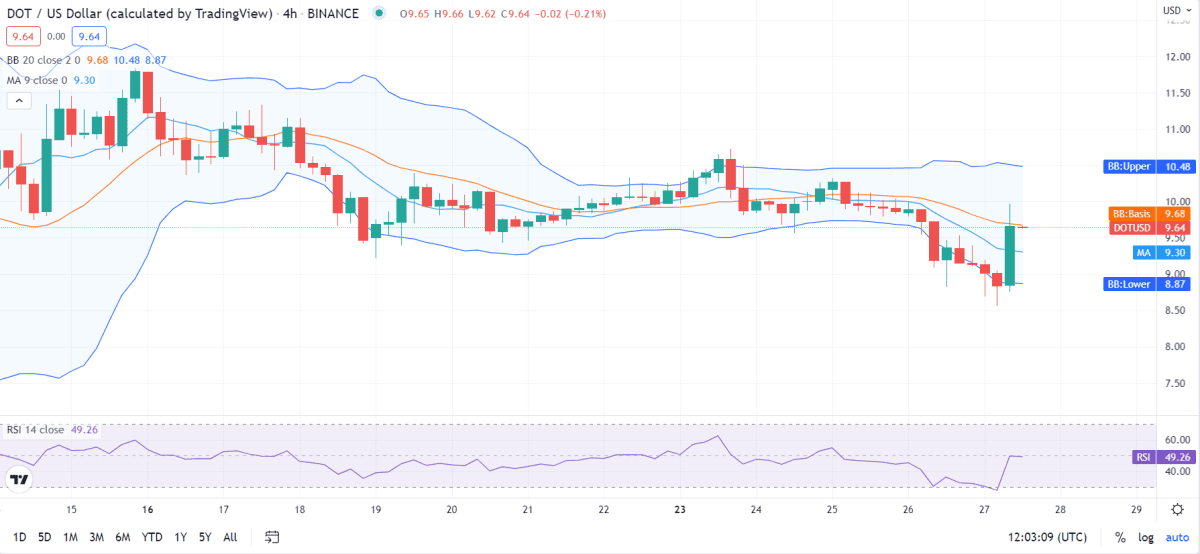
Polkadot price analysis reveals the Relative Strength Index (RSI) score to be 49, which falls in the central-neutral region. The RSI score follows a linear movement in the stable region, signifying unfaltering stability. The DOT/USD price has found a stable place within the market and has anchored itself there. The equivalence of selling and buying activity causes the RSI to remain dormant.
Polkadot price analysis for 1-day: Market enters a squeeze
Polkadot price analysis reveals the market volatility to enter a squeezing movement; it’s become so low as the resistance, and support bands come closer. The cryptocurrency price will follow the volatility and become less susceptible to volatile change. The upper limit of the Bollinger’s band is present at $12.38, acting as the strongest resistance for DOT. The lower limit of the Bollinger’s band is present at $8.24, representing the strongest support of DOT.
The DOT/USD price appears to cross under the Moving Average curve signifying a bearish movement. The price moves downward towards the support band, attempting to break it. If the support breaks, the movement is expected to shift to an upward movement with opening volatility. The breakout could prove to be a good thing for the bulls as they will have every chance to strike back and take the market completely.
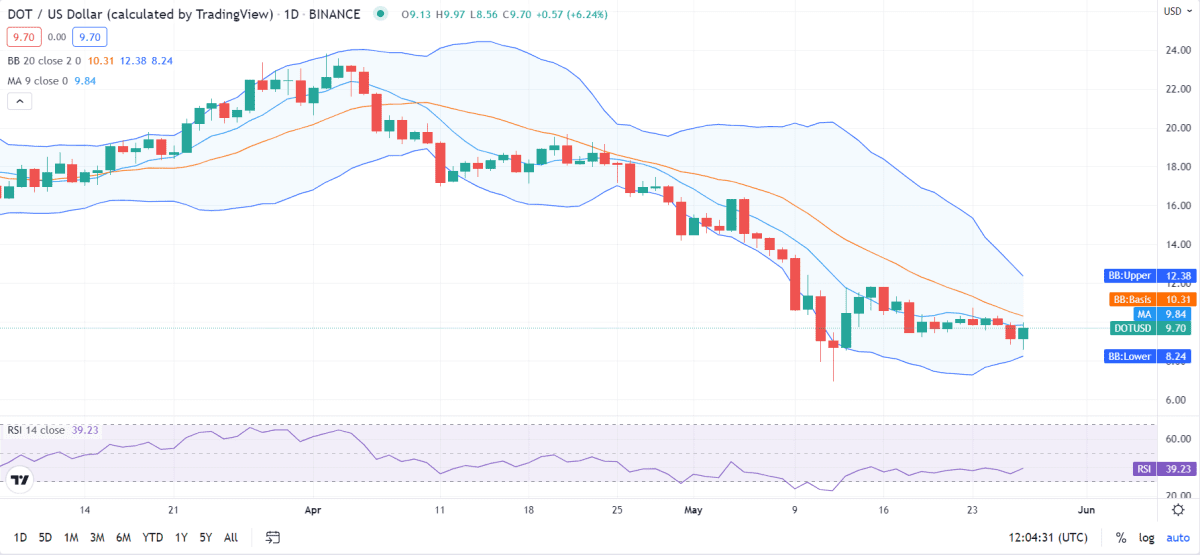
Polkadot price analysis reveals the Relative Strength Index (RSI) to be 39, indicating that the cryptocurrency is undervalued. Polkadot falls just below the lower neutral region. However, its position is bound to change as the RSI score follows an upward movement indicating dominant buying activity.
Polkadot Price Analysis Conclusion
Polkadot price analysis concludes that the cryptocurrency packs massive potential for positive movement; however, for now, the market is stuck with a bearish movement, which is expected to change in the coming days. If the bulls can pull this off, they will e rulers of the market. Moreover, the cryptocurrency will have the chance to reach new heights.
Disclaimer. The information provided is not trading advice. Cryptopolitan.com holds no liability for any investments made based on the information provided on this page. We strongly recommend independent research and/or consultation with a qualified professional before making any investment decisions.