Litecoin price analysis shows that the LTC/USD pair is currently in a bearish trend as the price has slipped below the $62mark. The bears have taken control of the market and are pushing the price down. The next support for the pair is present at $61.34, and if the price breaks below this level, it can fall to $58. The next resistance for the pair is present at $65.46, and if the price breaks above this level, it can rise to $68.

Litecoin prices have been trading between a range of $61.34 and $65.46 for the past 24 hours as the market has been consolidating. However, today, the bears have taken control of the market and are pushing the price down. The market cap for the coin is currently at $4,415,633,506, and the 24-hour trading volume is at $773,277,311.
Litecoin price analysis on a 1-day price chart: LTC/USD continues downside after facing rejection of $65.46
On the 1-day chart, we can see that Litecoin price analysis has been following a downtrend last 24 hours as the price has formed lower highs and lower lows. The price has recently found support at $61.34, and the bulls have attempted to push the price up. However, they have been rejected at $65.46, and the price has started to move downwards again.
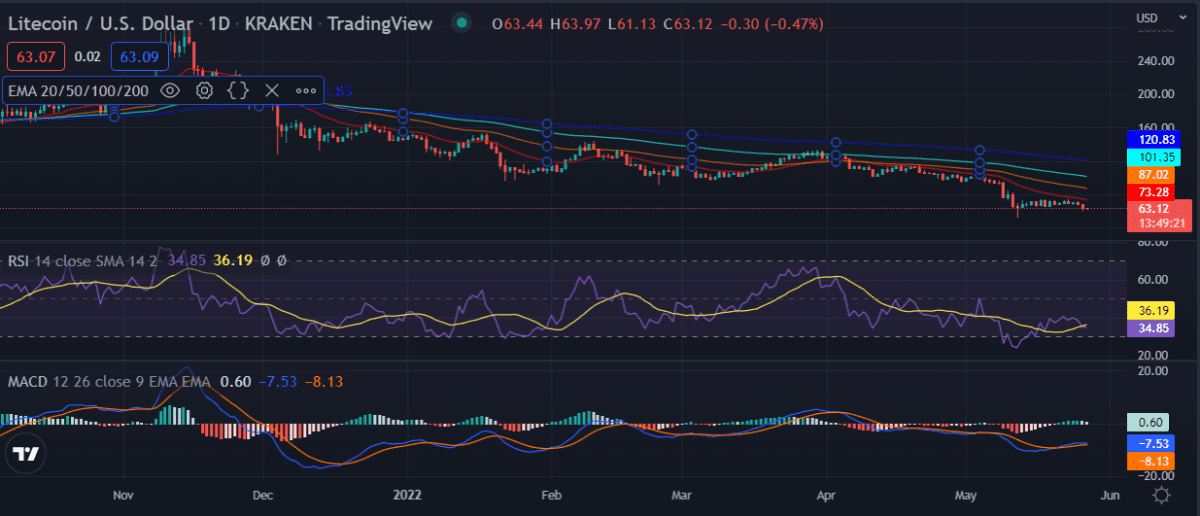
The MACD indicator shows that the market is in a bearish trend as the MACD line has crossed below the signal line. The RSI indicator is currently at 40, and it shows no signs of bullish momentum. The 100 EMA line is currently at $70.05, and the 200 EMA line is at $75.48, which shows that the path of least resistance is to the downside.
LTC/USD 4-hour price analysis: Recent developments and further technical indications
Litecoin price analysis on the 4-hour chart shows that the LTC/USD pair has followed a downtrend in the past few hours. The LTC market lost ground after a strong rejection at $65.46 and support at $61.34.
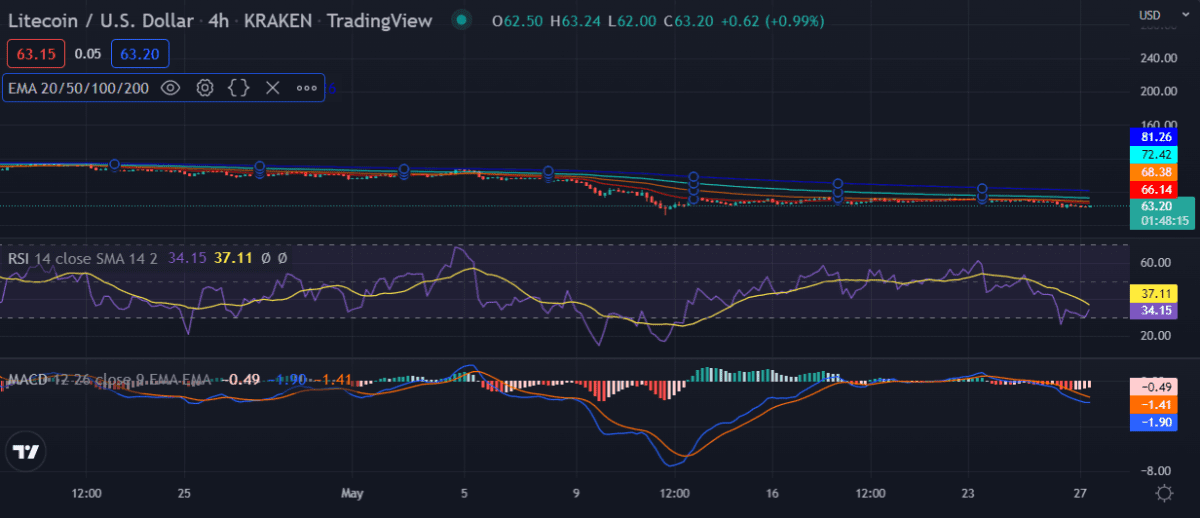
The RSI is above the oversold territory with a value of 43. The MACD is currently bearish with the MACD line crossing below the signal line. The 100 EMA line is currently at $69.07, and the 200 EMA line is at $73.62, which indicates a bearish trend.
Litecoin price analysis conclusion
Litecoin price analysis in conclusion indicates a market that is currently in a correction phase after the prices surged higher in the past two weeks as the technical indicators are bearish. The market is facing some selling pressure as the prices pulled back to $62.84 The technical indicators suggest that the prices may consolidate around current levels or retrace lower in the near term.
Disclaimer. The information provided is not trading advice. Cryptopolitan.com holds no liability for any investments made based on the information provided on this page. We strongly recommend independent research and/or consultation with a qualified professional before making any investment decisions.