- The looping coin has been receiving high-speed rejections since the beginning of April, resulting in the coin losing around 20% in value over the past 24 hours.
- The RSI indicator failed to move above the halfway mark (50 points) on the daily price scale.
- The Loopring coin with the bitcoin pair exists with a drop of 16.7% on 0.00001647 satoshis.
Over the past week, Loopring investors were celebrating a bullish rally after a pullback from 90-day lows. But near the descending trend line, the bulls were rejected for a higher outlook. Thus, the price action indicates less momentum from the previous night.
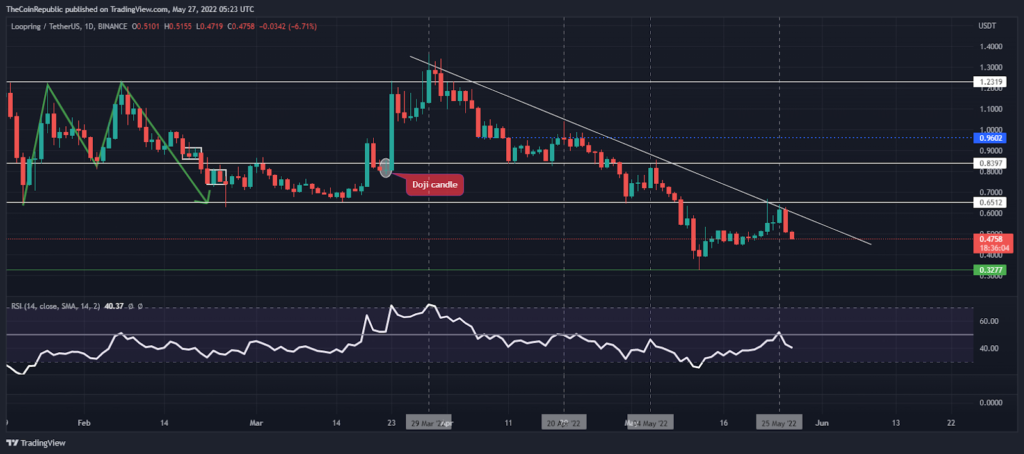
The downtrend line has retested several times and if the bulls manage the looping coin price above the 90-day low, it could be breached on the next attempt. Thus, the LRC coin has lost almost 20% in value over the past 24 hours.
Meanwhile, the Looping (LRC) token was trading at the $0.4736 mark at the time of writing. For the upcoming trading sessions, the $0.30 mark appears to be an important hedge zone for the looping investors.
Amidst the downtrend, the market continued to decline and reached $628 million as per CMC data for the last 24 hours. Furthermore, the coin looping with the bitcoin pair exists with a drop of 16.7% on 0.00001647 satoshis.
Along with the price action of LRC coin, the RSI indicator continues to decline near the descending trendline (mentioned in the chart). So over 45 days, the RSI remains below the peak half-line (50 points) and recently the RSI indicator failed to move above the halfway mark (50 points) on the daily price scale.
Bulls are far away from LRC coin
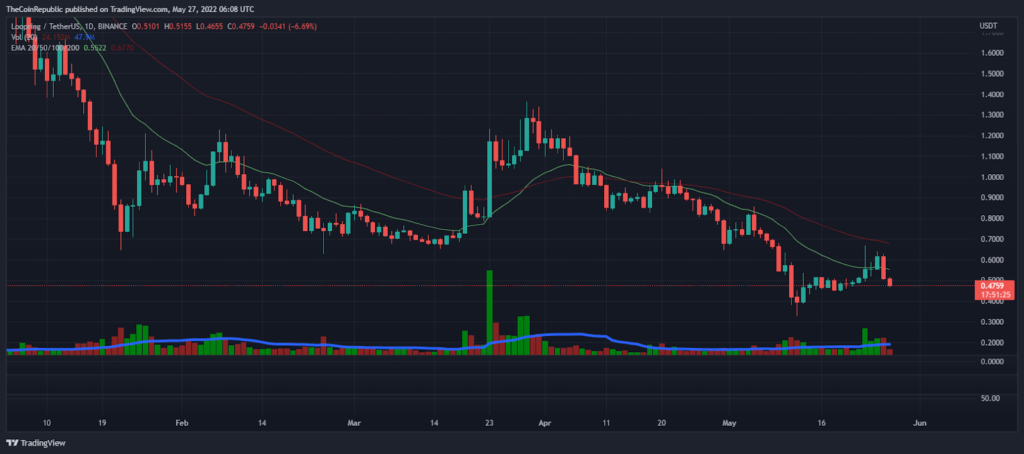
The volatility in the looping coin has been increasing this week compared to last week, so the bears tend to be more aggressive than the bulls. However, trading volume fell to $254 million last night.
In terms of the daily price graph, the 50 EMA has been a volatility red zone for the past several weeks. During the decline, the 20 and 50 EMAs are above the current price of the looping coin.
Conclusion
May This week the looping coin price will continue to decline. For the upcoming trading sessions, the $0.30 mark appears to be an important hedge area for the looping investors.
Technical Levels
Support level – $0.40 and $0.30
Resistance level – $0.65 and $1.0
Disclaimer
The views and opinions stated by the author, or any people named in this article, are for informational ideas only, and they do not establish the financial, investment, or other advice. Investing in or trading crypto assets comes with a risk of financial loss.