- On May 27, the bullish DOT price analysis is at $11.70.
- DOT’s bearish market price analysis for May 27, 2022, is $7.70.
- Polkadot’s MA shows a downward trend.
In Polkadot (DOT) price analysis on May 27, 2022, we use price patterns, and Moving Average about DOT to analyze the future movement of the cryptocurrency.
Polkadot (DOT)
DOT is the native cryptocurrency of Polkadot. A blockchain interoperability system protocol was established in 2016. It is a sharded blockchain, which means that many different chains are connected to the same network, which allows them to process and transfer data between chains in parallel without sacrificing security.
Polkadot (DOT) Price Analysis
DOT price analysis on May 27 2022 is explained below within a four-hour time frame.
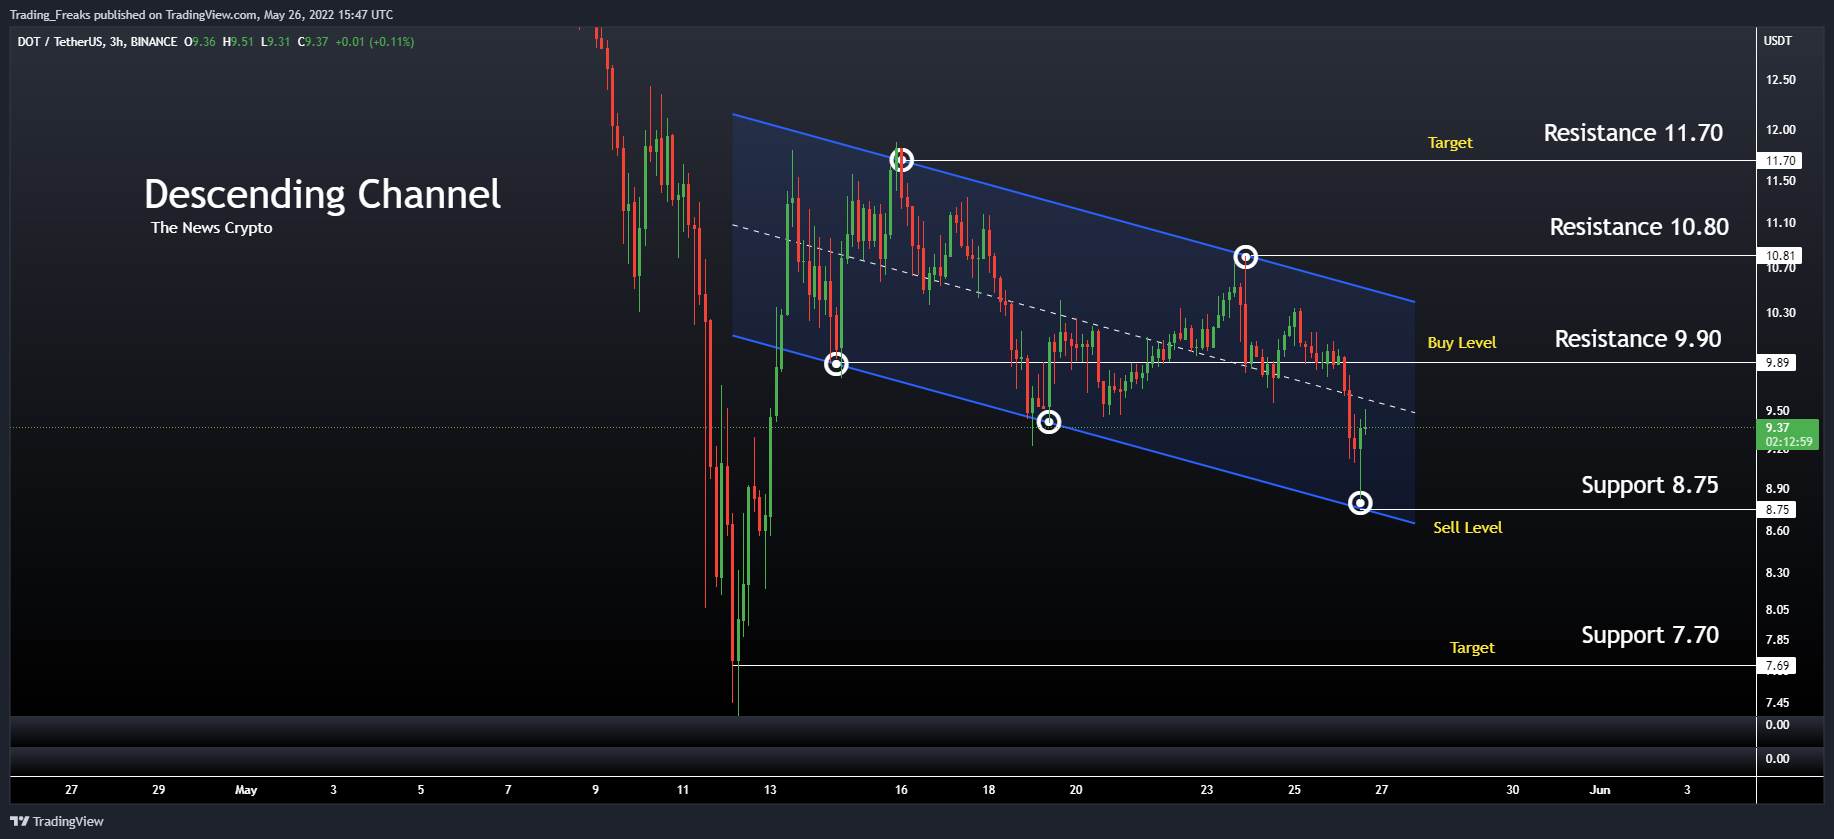
The ascending triangle pattern is a bullish pattern that usually forms during an uptrend as a continuation pattern. There are instances when ascending triangles form as reversal patterns at the end of a downtrend but they are typically continuation patterns.
The upper trend line must be horizontal, indicating nearly diagonally, identical highs, which form a resistance level. The lower trendline is rising diagonally, indicating higher lows as buyers patiently step up their bids.
Currently, the price of DOT is $8.92. If the pattern continues, the price of DOT might reach the resistance level of $11.70 and the buy level of $9.90. If the trend reverses, then the price of DOT may fall to $7.70 and the sell level of DOT is $8.75.
Polkadot (DOT) Moving Average
The DOT’s Moving Average (MA) is shown in the chart below.
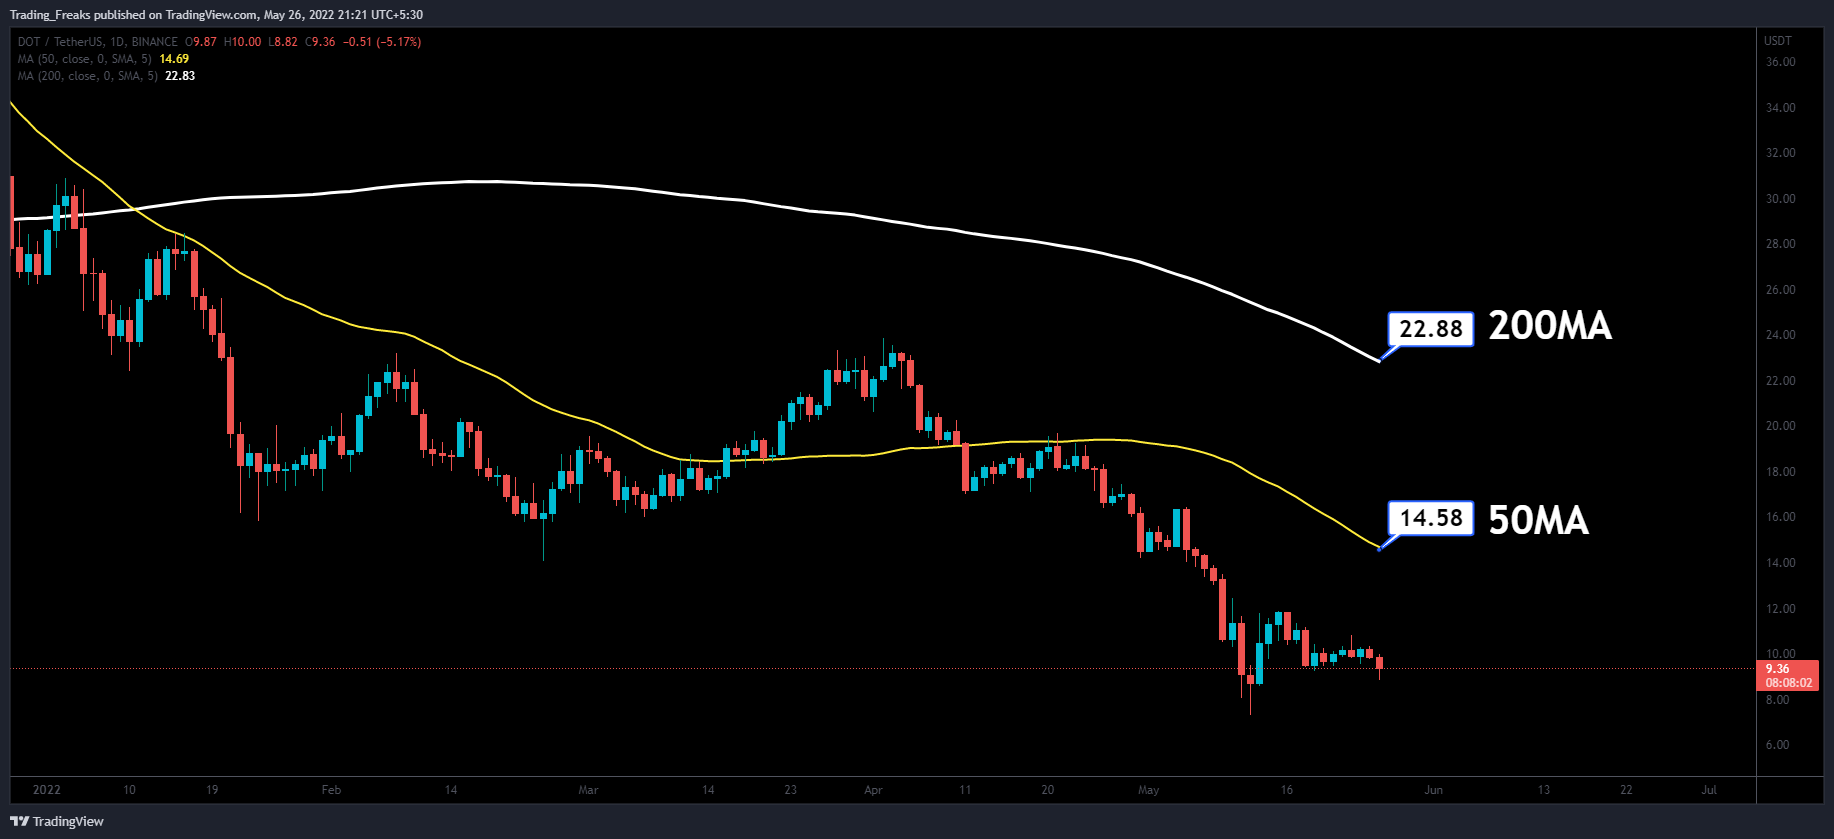
Currently, DOT is in a bearish state. Notably, the DOT price lies below 50 MA (short-term), and also lies below 200 MA (long-term). Once it completely lies above both 50 and 200 MA it is said to be a bullish trend. Therefore, there is a possibility of a reversal trend of DOT at any time.
Disclaimer: The opinion expressed in this chart solely author’s. It does not interpreted as investment advice. TheNewsCrypto team encourages all to do their own research before investing.