DIVI price action shows an inverted rounding bottom pattern as the correctio rally starts after the rejection at $17. Will the breakdown crack the $15 base? Key technical points:
- The DIVI market value increased by 3.86% in the last 24 hours.
- The inverted rounding bottom pattern has a neckline at $15.
- The 24-hour trading volume of Divi is $329,518, indicating a rise of 38.7%.
Past Performance of DIVI
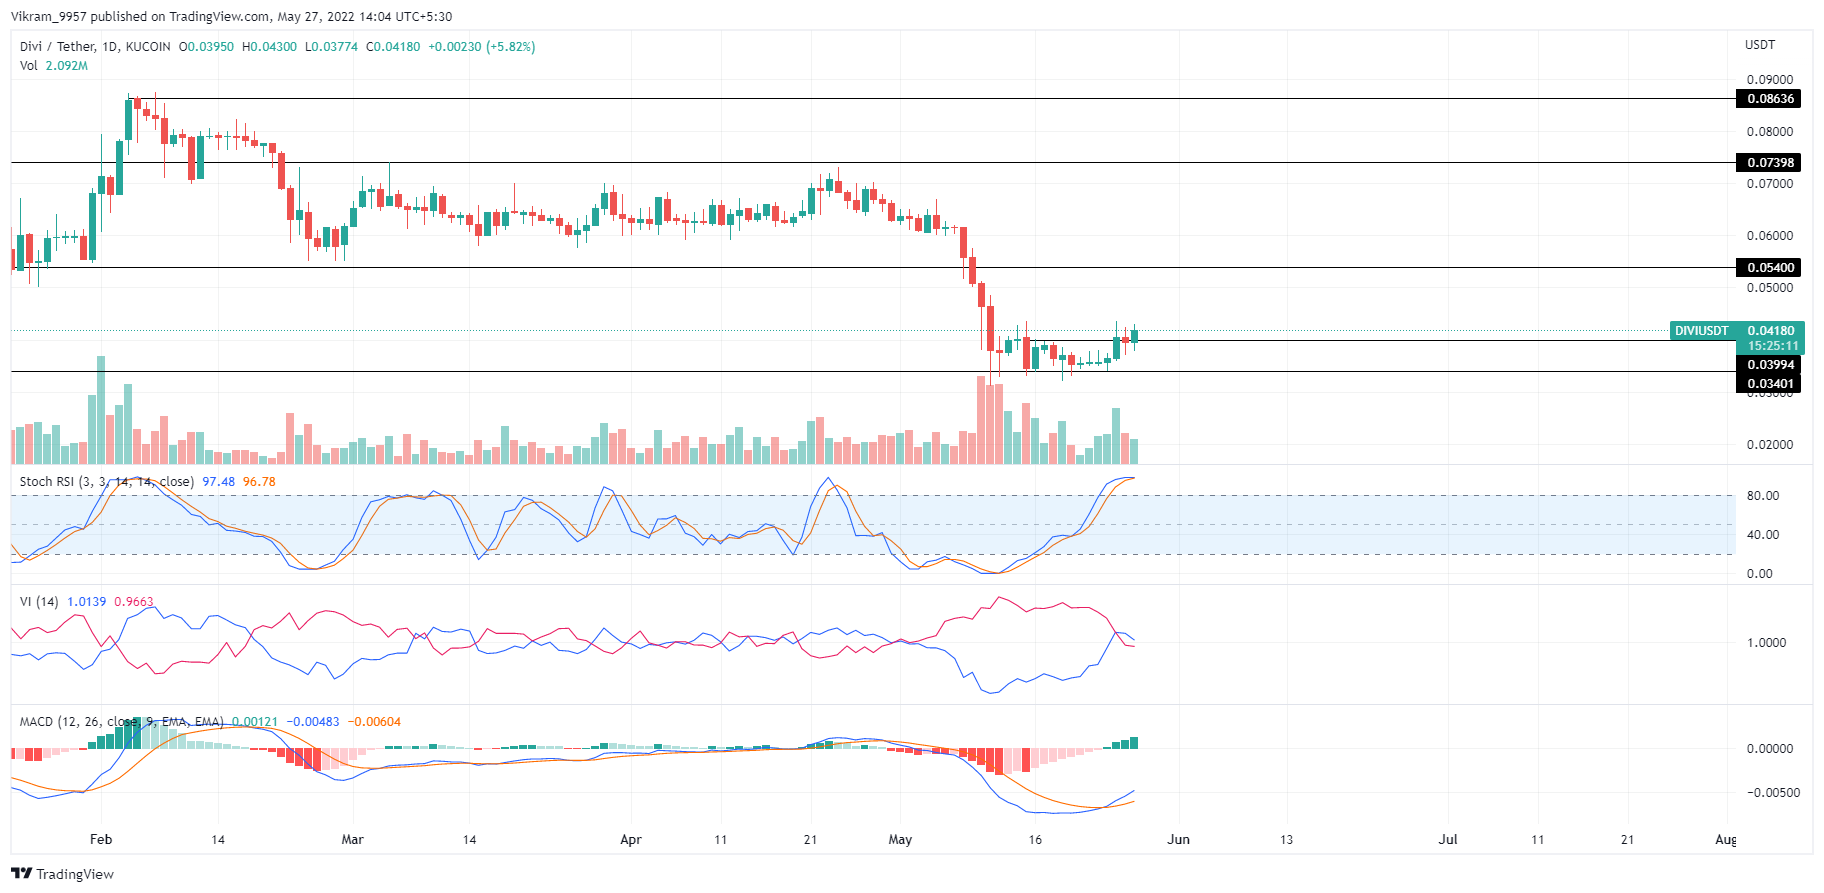
DIVI prices fail to surpass the $0.073 overhead resistance of a consolidation range formed above $0.054. However, the bullish failure led to a drastic 50% downfall in market price starting on 26th April before taking support at $0.035 on 16th May. The bullish support creates a rounding bottom pattern leading to a bullish reversal.  Source-Tradingview
DIVI Technical Analysis
DIVI price breaks above the rounding bottom’s neckline at $0.039 effortlessly but struggles to sustain above it. It is evident by the higher price rejection we see in the daily candles and a potential threat of an evening star pattern. The MACD indicator shows a bullish crossover supported by the positive growth of bullish histograms. The uptrend in the MACD lines reflects a solid underlying bullishness and promotes a recovery rally to $0.054. Supporting the MACD indicator, the Vortex indicator struggles to sustain the bearish spread and hints at an early bullish crossover. This will undermine the previous bearish attempt and mark a buying spot. However, the Stochastic RSI indicator shows a negative merger of the K and D lines in the overbought territory marking the possibility of a bearish fall below the 70% barrier. Hence, the indicator questions the possibility of a recovery rally sustaining above the $0.039 neckline. In short, the DIVI technical analysis indicates a high possibility of a recovery rally, but we must wait for a price action confirmation.
Upcoming Trend
If the sellers undermine the higher price rejection to find a closing above $0.039, a recovery to $0.054 is inevitable as the buying pressure grows. However, an unlikely fallout will result in a negative retracement to $0.030. Resistance Levels: $0.054 and $0.075 Support Levels: $0.034 and $0.030
 cryptoknowmics.com