The cryptocurrency market has been seeing massive price volatility that has worked positively for the coins on the charts. Popular cryptocurrencies like Bitcoin [BTC], XRP and Ethereum [ETH] all witnessed uptrends that lifted their prices and protected their price supports.
1 hour:
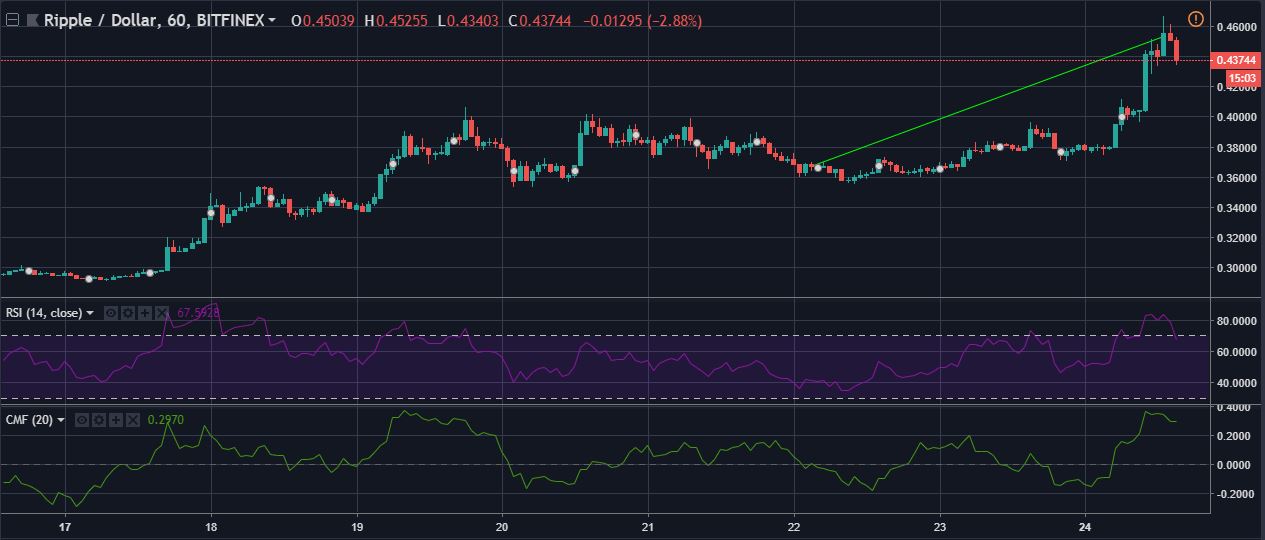
XRP’s one-hour graph shows a spike that lifted its price from $0.369 to $0.455. The support has been holding at $0.292 while the immediate resistance is at its recent spike, $0.455.
The Relative Strength Index [RSI] has broken the overbought zone and has dipped towards the graph again. This is a sign of the buying pressure being significantly higher than the selling pressure.
The Chaikin Money Flow indicator has shot above the zero lines and is holding strong at that point. This shows that the money coming into the market is much more than the money flowing out of the market.
1 day:
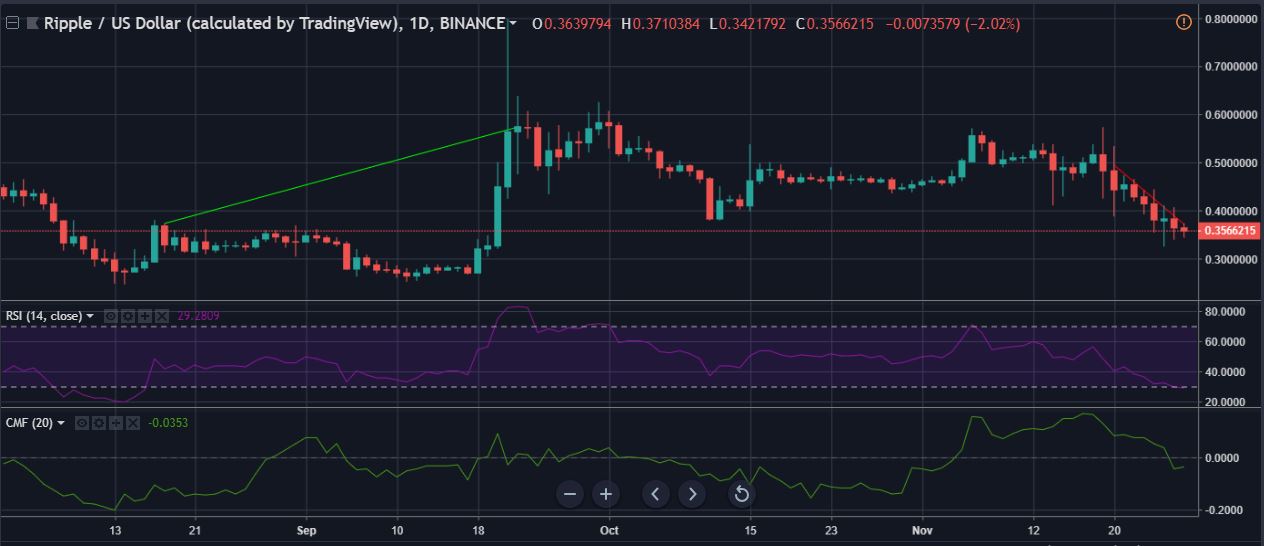
The one-day graph for XRP shows a cryptocurrency recovering from its price slump. The recent downtrend witnessed the prices fall from $0.51 to $0.292 while the following uptrend lifted the price from $0.312 to $0.436. The long-term support has been holding at $0.2593.
The Bollinger band shows a divergence with the upper band and the lower band moving away from each other. The latest bullish spike has contributed to the divergence as the price candle has left the Bollinger cloud.
The MACD indicator points to the signal line and the MACD line both moving upwards, a bullish sign. The divergence between the two lines also indicates a prolonged bullish run. The MACD histogram, on the other hand, has been a sporadic mix of bullish and bearish signals.
Conclusion:
The above-mentioned indicators all show XRP enjoying the bull run towards the end of the year. The price supports seem to be safe for the moment while the bullish spikes will reduce in frequency.