The Cardano price analysis shows a considerable decline in the price levels. Bears have been dominating the market, and the price levels have been decreasing continuously since 25 May 2022; currently, the price has come down to $0.459. The past few hours have been critical for coin value as the bearish momentum has been huge and overpowering, and yet the cryptocurrency hasn’t found the support.
ADA/USD 1-day price chart: Bulls yet helpless to step in for support
The 1-day chart for Cardano price analysis shows cryptocurrency progress is in the negative direction. The bears have been successful enough to carry on their lead for the third day consecutively. The price is currently set at $0.459 after losing nearly 10 percent value during the last 24 hours, and as the momentum intensifies, it is much more likely to go even further lower. The moving average (MA) indicator is above the price level, i.e., at $0.511, as the bearish momentum has been considerable.
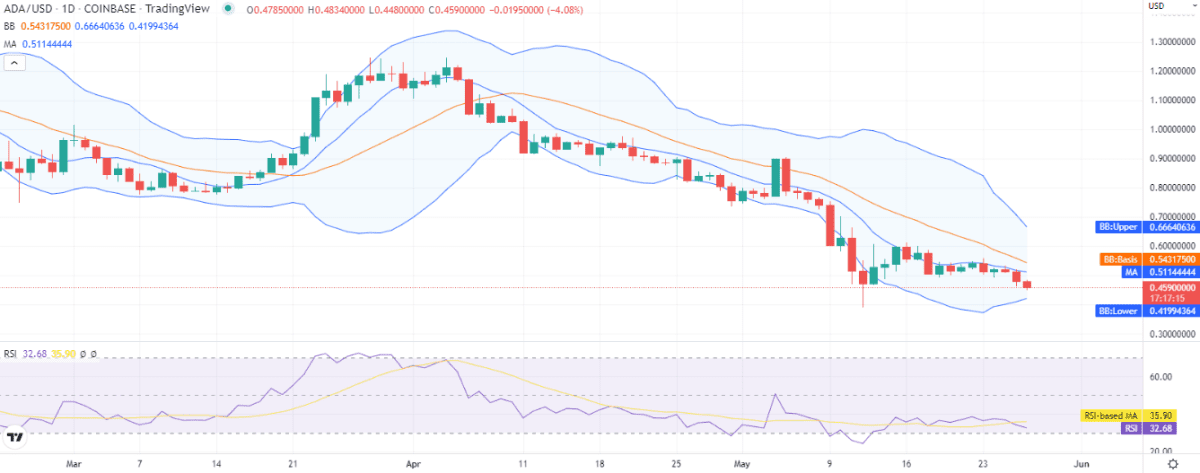
The volatility is also decreasing, which is a negative indication for the bulls, with the upper Bollinger band reaching $0.666 and the lower band reaching $0.419. The Relative Strength Index (RSI) score, on the other hand, is also falling critically as it is at index 32.
Cardano price analysis: Recent developments and further technical indications
The 4-hours price chart for Cardano price analysis shows extreme deterioration in price value after a huge loss in price in the past hours. The momentum has taken the price levels down to $0.459, which is the lowest of the past year. The moving average is $0.488, and the Bollinger bands display the following figures; the upper Bollinger band is present at $0.542 while the lower band is present at $0.465, respectively. The price has stooped low below the lower limit of the Bollinger bands, which is a strong bearish indication.
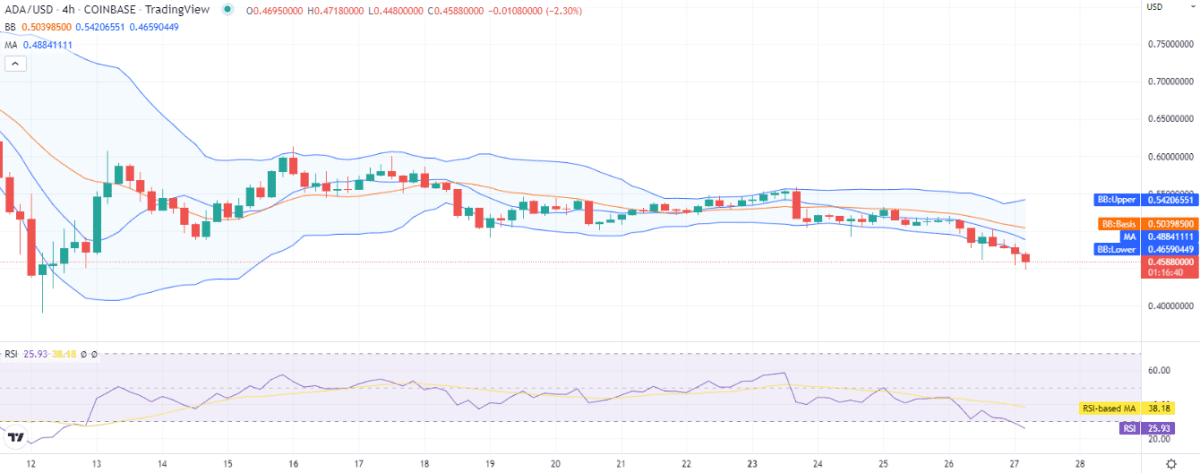
The trending line is going in favor of the bears, yet there is a strong chance of a further drop in price in the upcoming weeks. The RSI score is 25, which is very low and in bearish territory.
The overall trend is towards the bearish side, as the past week has seen a greater number of red candlesticks on the chart. The technical indicators show us that a total of 16 indicators are present on the selling side, nine at the neutral, and only one on the buying side.
Cardano price analysis conclusion
From the above 1-day and 4-hours Cardano price analysis, we can see that the bears are in dominating position and the bearish momentum is strong. The coin price levels have reached down to $0.459 low. The support level at $0.419 is still further below, so we expect ADA to continue downside for today,
Disclaimer. The information provided is not trading advice. Cryptopolitan.com holds no liability for any investments made based on the information provided on this page. We strongly recommend independent research and/or consultation with a qualified professional before making any investment decisions.