Key Highlights
- Ripple price gained bullish momentum and broke the $0.3905 resistance against the US dollar.
- There was a break above a bullish continuation pattern with resistance at $0.3800 on the 4-hours chart of the XRP/USD pair (data source from Poloniex).
- The pair is currently trading well above $0.4250 and it could continue to move higher towards $0.4500-0.4600.
Ripple price gained more than 15% and broke $0.4250 against the US Dollar. XRP is likely to accelerate above the $0.4400, $0.4500 and $0.4600 resistance levels.
Ripple Price Analysis
After forming a support base near $0.2800, ripple price jumped above $0.3000 against the US Dollar. The XRP/USD pair gained momentum above the $0.3200 resistance and a bearish trend line. Later, buyers pushed the price above the $0.3500 resistance and the 55 simple moving average (4-hours). As a result, there was a sharp upside move above the $0.3900 and $0.4000 resistance levels.
More importantly, there was a break above a bullish continuation pattern with resistance at $0.3800 on the 4-hours chart of the XRP/USD pair. The pair climbed above the $0.4250 level and traded as high as $0.4325. In the short term, there could be a minor downside correction towards $0.4110. The 23.6% Fib retracement level of the last wave from the $0.3436 low to $0.4325 high is at $0.4115. However, the main support is near the $0.3905, which was a resistance earlier. It coincides with the 50% Fib retracement level of the last wave from the $0.3436 low to $0.4325 high. Therefore, dips from the current levels may find bids near $0.4110, $0.4000 and $0.3900.
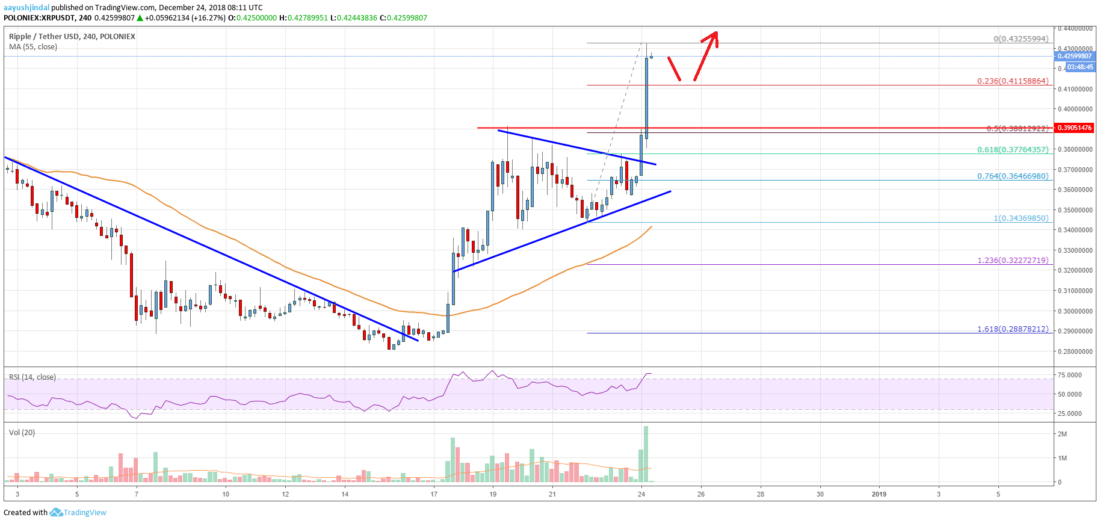
Looking at the chart, ripple price looks set to gain pace above $0.4350, $0.4400 and $0.4500. If there is downside correction, buyers are likely to protect $0.3900-0.4000 in the near term.
Looking at the technical indicators:
4-hours MACD – The MACD for XRP/USD is placed nicely in the bullish zone.
4-hours RSI (Relative Strength Index) – The RSI for XRP/USD is currently near the 75 level.
Key Support Level – $0.3900
Key Resistance Level – $0.4500