Tezos price analysis shows a bearish trend for XTZ/USD as the cryptocurrency slips to $1.90. However, support is still present at $1.83 and if the price can rebound from here, we may see it head back towards $2.22.The bulls had attempted to push prices higher but failed as the market found support at $1.83.
The cryptocurrency has a market trading volume of $149,634,813, with a market capitalization of $1,706,204,260. The digital asset is currently trading at $1.90, a fall of 1.5% over the past 24 hours. Looking at the hourly XTZ/USD chart, we see that the market has formed a descending channel pattern. The price bounced off the upper boundary of this percent in the last 24 hours. The market is expected to continue its decline as market sentiment remains.
Tezos price movement in the last 24-hour: Bears mount pressure on XTZ prices
Tezos price analysis for the 24-hours price chart shows that the XTZ/USD has been on a downtrend for the last 24-hours. The next few hours of trading are crucial for the market as the market is expected to make a move. The market is currently facing resistance at the $2.22 level, and a break above this level can see prices test the $3 level. However, if the market fails to move above this level, we expect prices to fall towards the $1.83 support level.
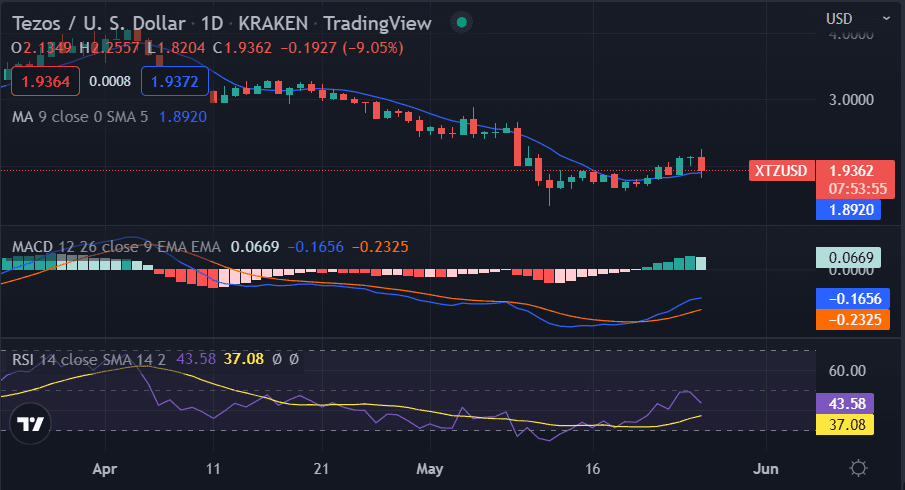
The RSI indicator is currently at the 53.15 level and is slowly moving towards the oversold region, which shows that selling pressure is still present in the market. The MACD indicator is bearish as the signal line is above the histogram. This indicates that the bears are in control of the market. The MA50 is currently at the $2.06 level, and the MA200 is at the $2.42 level.
Tezos price analysis on a 4-hour price chart: XTZ set to test the further downside
The 4-hour price chart for XTZ/USD shows that the market is in a bearish trend as the market has formed a descending channel pattern. The market is expected to find support at $1.83, and if the price can rebound from here, we may see it head back towards $2.22. The RSI indicator is above the 50 level, which indicates that the market is in a consolidation phase.
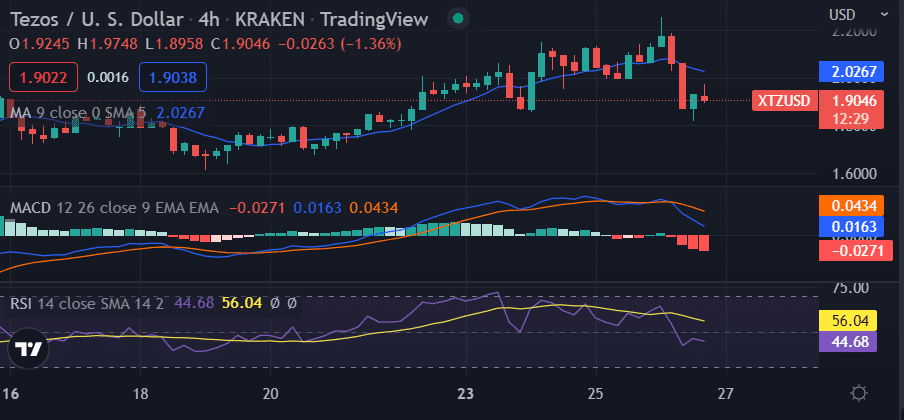
The MACD indicator is below the signal line, which indicates that the bears are in control of the market while the MA indicator is currently in a bearish trend.
Tezos price analysis conclusion
Tezos price is bearish, and a further decline is expected in the market. The bulls had attempted to push prices higher but failed as the market found support at $1.83. The investors are currently waiting on the sidelines as market sentiment remains bearish as buyers are not yet convinced that prices have bottomed out. At the same time, sellers wait for prices to fall further before entering the market.
Disclaimer. The information provided is not trading advice. Cryptopolitan.com holds no liability for any investments made based on the information provided on this page. We strongly recommend independent research and/or consultation with a qualified professional before making any investment decisions.