Apecoin price analysis shows a bullish trend as the coin has recovered from its intraday low of $7.06 to reach a new high at $7.71. However, this level has acted as resistance for APE and prices have pulled back below $7.50. The current price stands at $7.49.
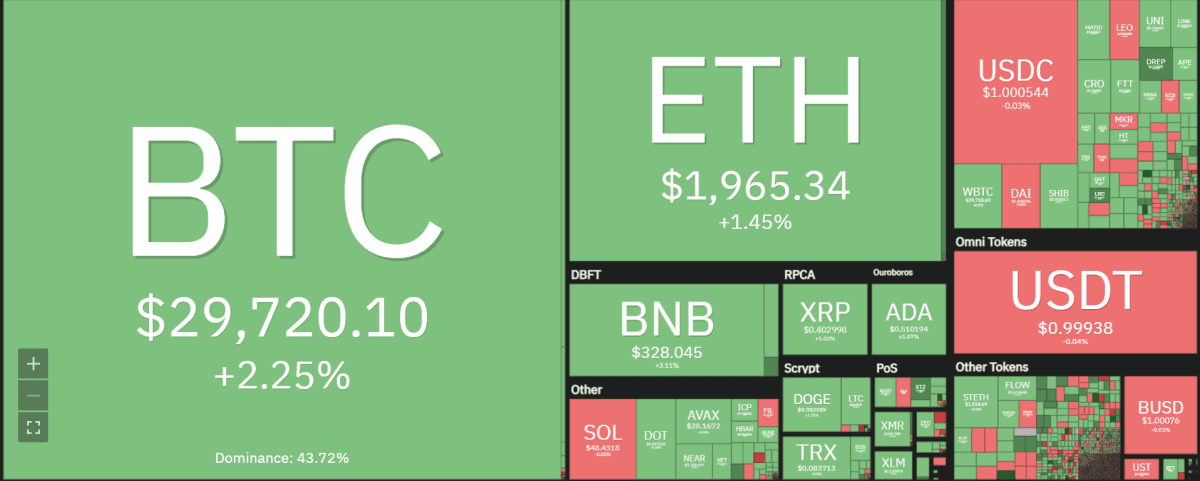
The market is looking to recover from the previous lows as prices correct higher. Apecoin’s price is currently trading at$7.49 after a minor correction from the highs of $7.71. The market had a good run in the past few days as prices surged by over 10%. However, the gains were short-lived as the market corrected lower. The market cap for the coin stands at $2,177,647,187, and the 24-hour trading volume is at $460,806,626.
APE/USD 1-day price chart: Bulls gear up for a push above $7.49
Apecoin price analysis over the past 24 hours shows that the coin had a good run as prices Show an uptrend. However, the gains were short-lived as the market corrected lower. The current market trend is bullish as the market looks to recover from the previous lows. The market is expected to resume its uptrend as prices look to test the $7.71 resistance level once again.
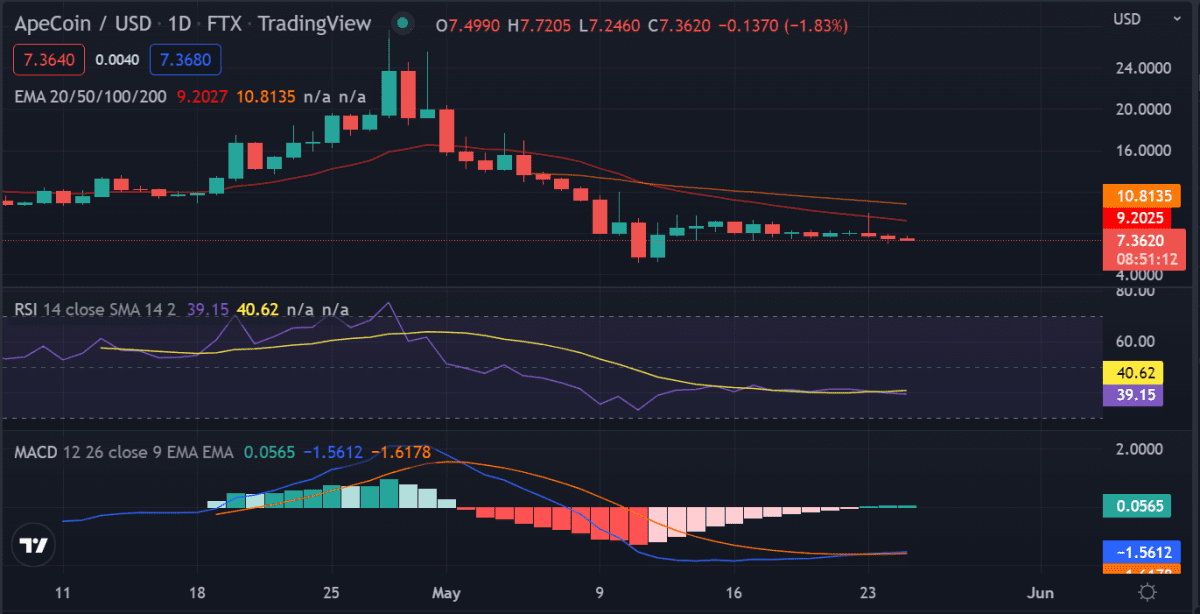
The RSI indicator is currently in the overbought region as prices look to consolidate at the current levels. The MACD indicator is also in the bullish zone as the market looks to resume its uptrend. The EMA indicator is currently in the bullish zone as the market looks to resume its uptrend.
APE price analysis on the 4-hour chart: Bulls stumble to keep control
The four-hour APE price analysis confirms an increasing trend as the price has covered an upward movement in the past 4 hours. This can be confirmed from the four-hour price chart, where the green candlesticks appear, indicating a rise in coin value. The bullish momentum has successfully rescued the price above the $7.49 margin, and it seems like the bulls are going to achieve their next target soon.
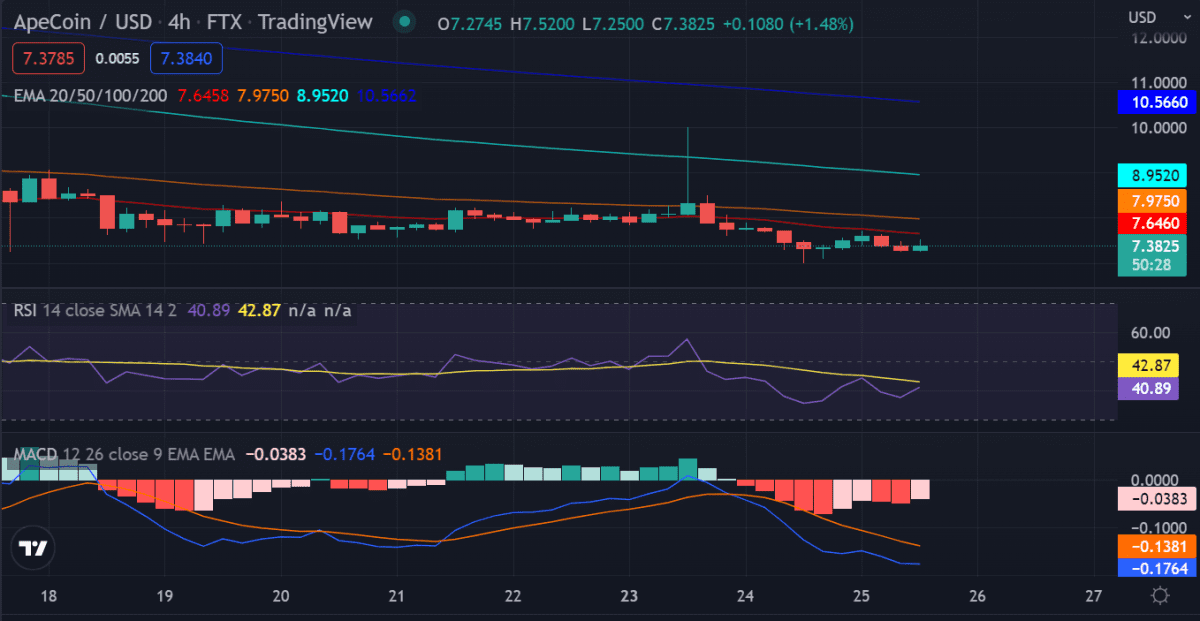
The MACD line is above the signal line, which indicates that the price is rising. The RSI indicator is above 60, which confirms the bullish market trend. The price is currently testing the $7.71 resistance level as it looks to resume its uptrend. The EMA is above the price as the market looks to resume its uptrend.
APE price analysis conclusion
Apecoin price analysis for today illustrates that the market opened in a bullish trend as the price reached a high of $7.49. The market then faced rejection and found support at $7.06. The market is expected to resume its uptrend as the market looks to test the $7.71 resistance level once again. Investor attention should be focused on the $7.71 resistance level as a breakout above this level could lead to further gains.
Disclaimer. The information provided is not trading advice. Cryptopolitan.com holds no liability for any investments made based on the information provided on this page. We strongly recommend independent research and/or consultation with a qualified professional before making any investment decisions.