Polygon price analysis shows that the bulls are losing steam and the bears are in control.MATIC prices have found support at $0.6517 and are currently facing resistance at $0.6901. The price has been falling for the last few days and it seems like the bears are in control.
Polygon prices have been trading between $0.6517 and $0.6901 for the past few hours with no clear direction.MATIC trading volume is seen to be picking up as the 24-hour volume stands at $525,649,284.The volume market cap for Polygon is currently at $5,009,762,054.
MATIC/USD 1-day price chart: Bearish pressure overwhelms the market
The one-day Polygon price analysis shows that the market has been under bearish pressure for the past few days. The price is currently facing resistance at $0.6901, which is likely to act as a strong barrier for the bulls. The MACD indicator is close to crossing into the bearish territory, which is a sign that the bears are gaining momentum. The RSI indicator is currently at 36 and it seems like the market is oversold.
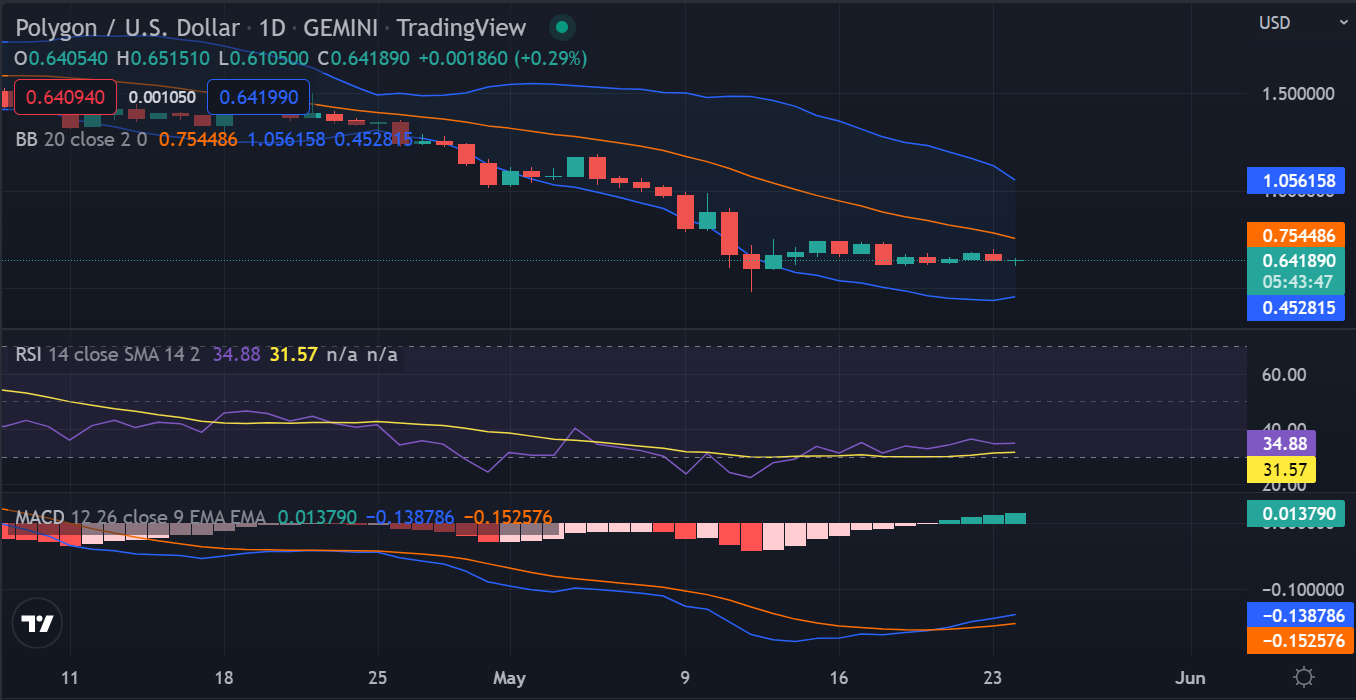
The five-day and 20-day exponential moving averages (EMA) are both bearish and they are both below the price. This is a sign that the bears are in control. Polygon is likely to remain bearish for the next 24 hours. The market volatility is high as the Bollinger bands are seen to be expanding.
Polygon price analysis: Recent developments and further technical indications
The 4-hour chart for Polygon price analysis shows the price has been decreasing continuously, and selling pressure is immense, as the price has been falling for the last 24 hours and the bearish momentum intensified in the last four hours, which provokes fear of a further decrease in price in the coming hours.
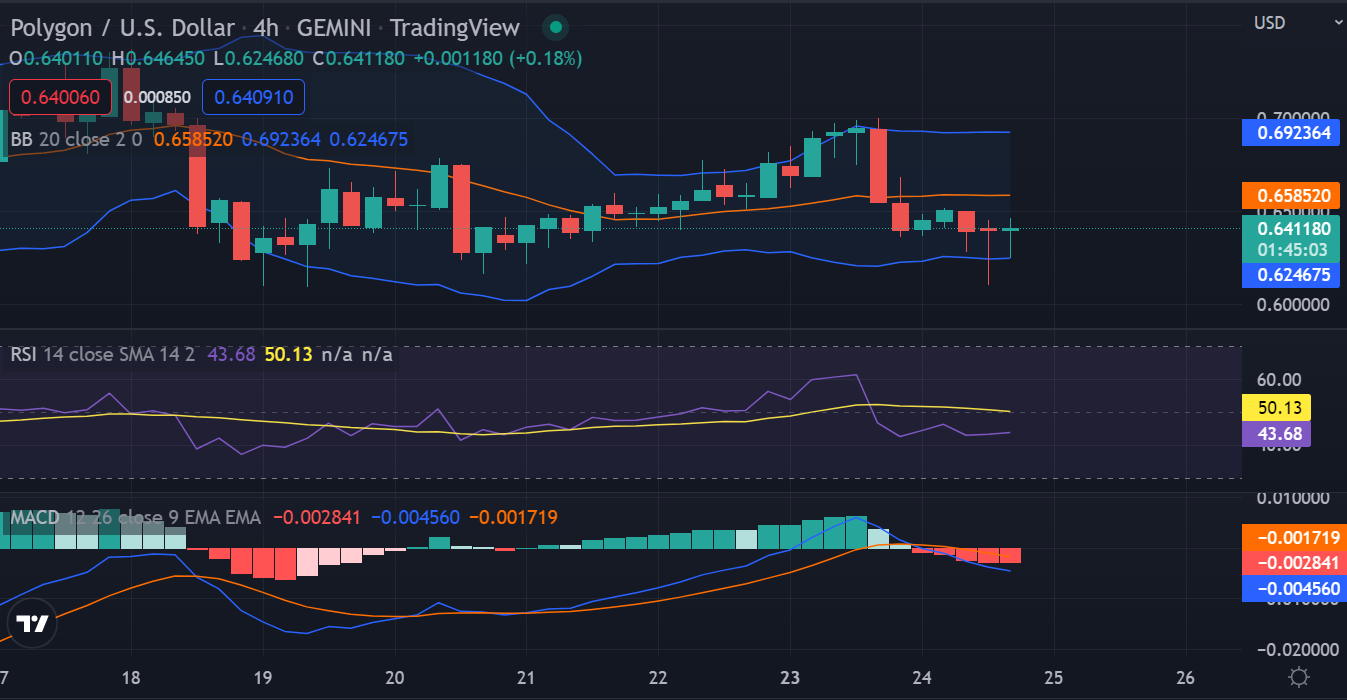
The MA is also trading at $0.68, however, the price has struggled to make a comeback and is currently trading at $0.67.The RSI is currently at a bearish trend, However, if the bulls manage to take control, we might see a move towards $0.691.MACD line(blue) is over the signal line(orange), which indicates a bearish move in Polygon price for the next few hours.
Polygon price conclusion
Polygon price analysis reveals that prices are currently in a bearish spell as prices have sought support at $0.6517. The current market sentiment is bearish, and if this persists, Polygon prices could retest lows of $0.6329. On the other side, resistance is seen at $0.6901, and a break above this level could see prices rallying to $0.7050, Bears are getting exhausted as the price is recovering, showing a slight upward trend as the bulls are trying to recover the market.
Disclaimer. The information provided is not trading advice. Cryptopolitan.com holds no liability for any investments made based on the information provided on this page. We strongly recommend independent research and/or consultation with a qualified professional before making any investment decisions.