Aave price analysis reveals that the price has been downward since yesterday, as the bears have successfully taken the lead. Today’s downturn was also apparent, with the price dropping to $94.78 as the bears recovered their power. The overall coin value has been damaged by this, as recovery prospects have been delayed. It is anticipated that further depreciation will follow in the next hours.
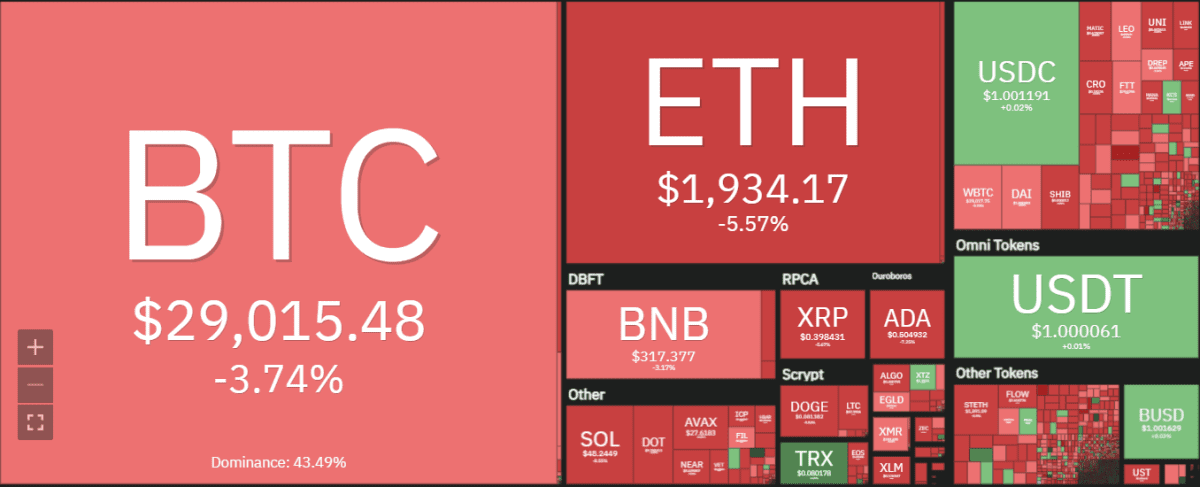
The market has been facing rejection at the $107.92 level since then and has found support at $94.78, as prices continue to fluctuate between these two levels. The bears are currently in control of the market, and a further price drop is expected in the next 24 hours. The cryptocurrency has a market trading volume which is at $ 271,764,887, with a market capitalization of $1,302,427,981. The digital asset is ranked in the 21st position on CoinMarketCap.
AAVE/USD 1-day price chart: Bears are in control as Aave prices fail to breakout
Aave price analysis over the past 24 hours has been bearish as prices have continually fallen. The market opened at $107.92 and quickly fell to a low of $94.78 as the bears took control. Prices have remained relatively stable since then, with no significant changes in either direction.
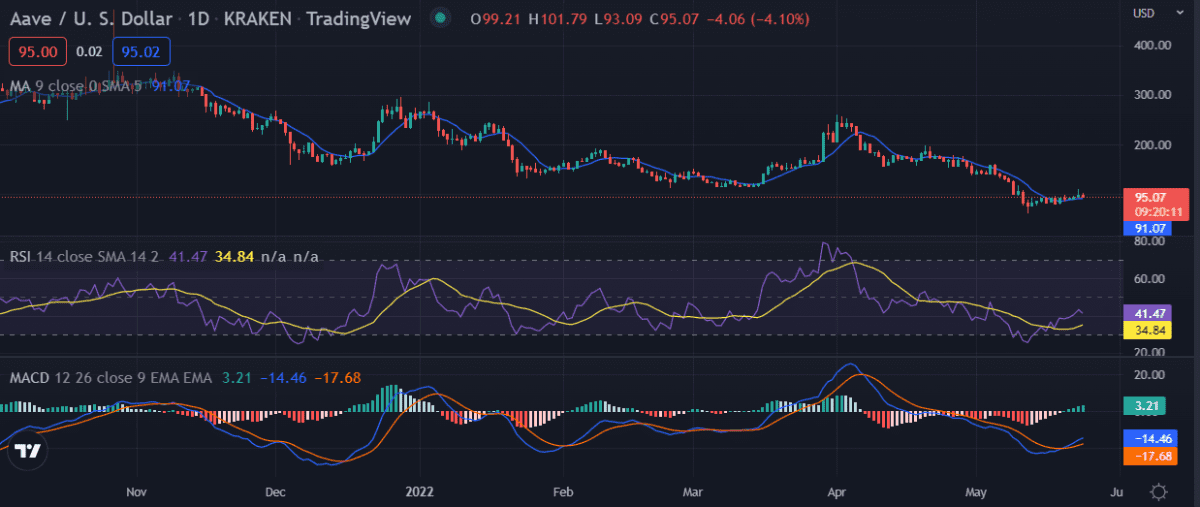
The RSI indicator is presently at 41.03 and is heading towards the oversold region, which indicates that the market may be due for a rebound in the near future. The MACD is also bearish as the signal line is above the candlesticks while MA indicator lines are bearish.
AAVE/USD four-hour price analysis chart: Recent developments and further technical indications
Aave price analysis shows AAVE prices are currently trading at $94.78 after a significant loss in value over the past day. The market is volatile, with bears and bulls fighting for control, leading to large swings in price. So far, the bears have been more successful as they push the price lower. This downward trend is expected to continue until a clear reversal sign is shown soon enough unless changes occur before some time passes, which seems unlikely given current circumstances.
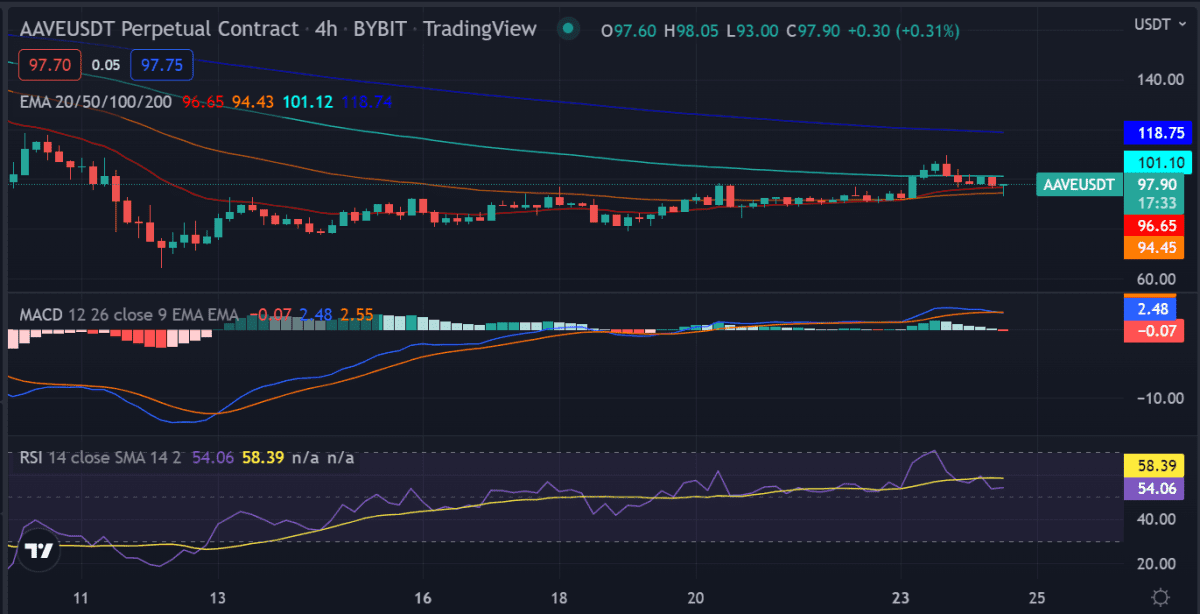
The technical indicator Relative Strength Index is at 41.03 and heading towards the oversold region. The Moving Average Convergence Divergence indicator is bearish as the signal line is above the candlesticks while MA indicators are bearish. These technicals suggest that a rebound may occur soon, but it is hard to predict when that will happen exactly.
Aave price analysis conclusion
The price experienced a drop today as it has been confirmed from the one-day and four hours Aave price analysis. Although the price went higher at the start of the trading session, following yesterday’s bulls trend, the bears are now back on track as they have been able to bring the price down to the $94.78 level. The cryptocurrency is to face more loss in the future as the hourly prediction has been on the unfavorable side as well.
Disclaimer. The information provided is not trading advice. Cryptopolitan.com holds no liability for any investments made based on the information provided on this page. We strongly recommend independent research and/or consultation with a qualified professional before making any investment decisions.