Today’s Shiba Inu price analysis displays a bearish movement in the market, and the market moves towards a negative direction, declining the price of SHIB significantly. After that, however, the cost of SHIB experienced a crash and decreased to $0.00001161, from $0.00001275; on May 23, 2022, SHIB/USD lost further momentum and obtained a massive decreasing movement the following day.
Today, on May 24, 2022, the price has been experiencing a massive downtrend, causing the price of SHIB to remain under the $0.00001180 mark. Furthermore, the cryptocurrency shows downside risks and is following a downward trend. SHIB currently trades at $0.00001172 and has been down 5.52% in the last 24-hours with a trading volume of $498,772,898. SHIB currently ranks #16 with a live market cap of $6,442,446,911.
SHIB/USD 4-hour analysis: Recent developments
Shiba Inu price analysis revealed the market following a solid bearish trend. However, the market volatility decreases, forcing the resistance and the support to move closer, making the cryptocurrency’s price less prone to volatility fluctuations. Consequently, the upper limit of the Bollinger’s band is present at $0.00001235, which acts as the strongest resistance for SHIB. Conversely, the lower limit of the Bollinger’s band is available at $0.00001137, which acts as the strongest support point for SHIB.
The SHIB/USD price appears to be crossing under the Moving Average curve, making the market bearish. Therefore, the market shows immense reversal opportunities and possibly favors the bulls. The price is expected to shift toward a downward movement due to the current movement towards the support, as the price attempts to break the support soon.
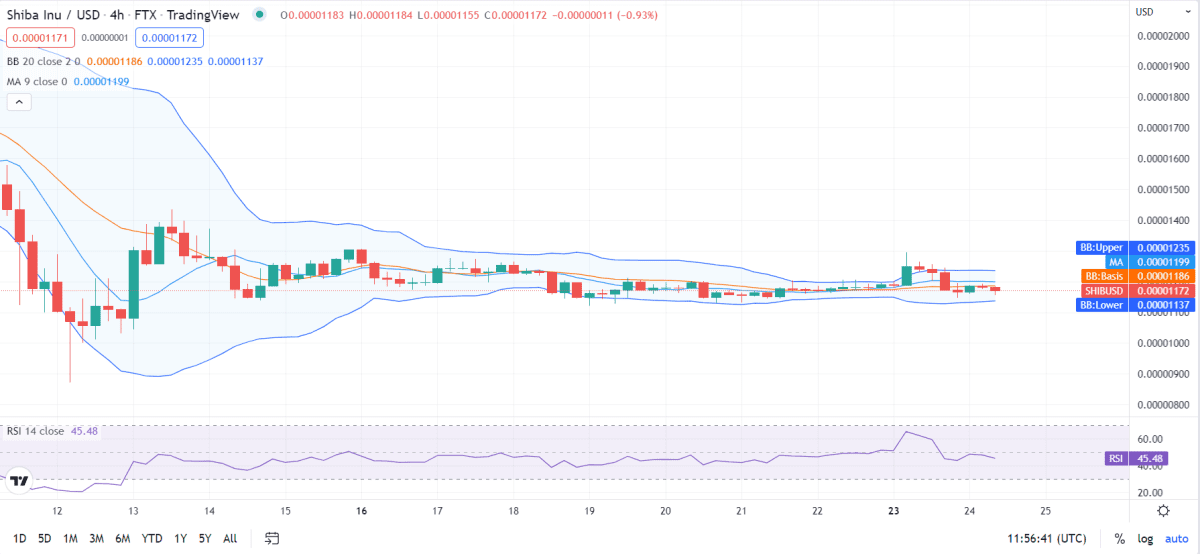
Shiba Inu price analysis reveals that the Relative Strength Index (RSI) score is 45 making SHIB/USD fall in the stable region. However, the RSI follows a downward trend indicating a decreasing market and dominance of selling activities. As the price attempts to break the support, the RSI is expected to shift to an upward movement as it has stayed constant for a while now.
Shiba Inu price analysis for 1-day: Market closes
Shiba Inu price analysis has revealed a bearish market. Moreover, the market’s volatility appears to follow a decreasing trend, making Shiba Inu’s price less vulnerable to volatility fluctuations. As a result, the upper limit of the Bollinger’s band is present at $0.00001992, which serves as the strongest resistance for SHIB. Conversely, the lower limit of the Bollinger’s band exists at $0.00000764, which acts as the strongest support for SHIB.
The SHIB/USD price appears to cross under the curve of the Moving Average, signifying a bearish movement. On the other hand, the price seems to follow a downward activity, showing a constantly decreasing market. Finally, the price has been trying to break the support once again, which will cause a breakout in the market. The market dynamic will be shifted in the bulls’ favor and prove to be a silver lining.
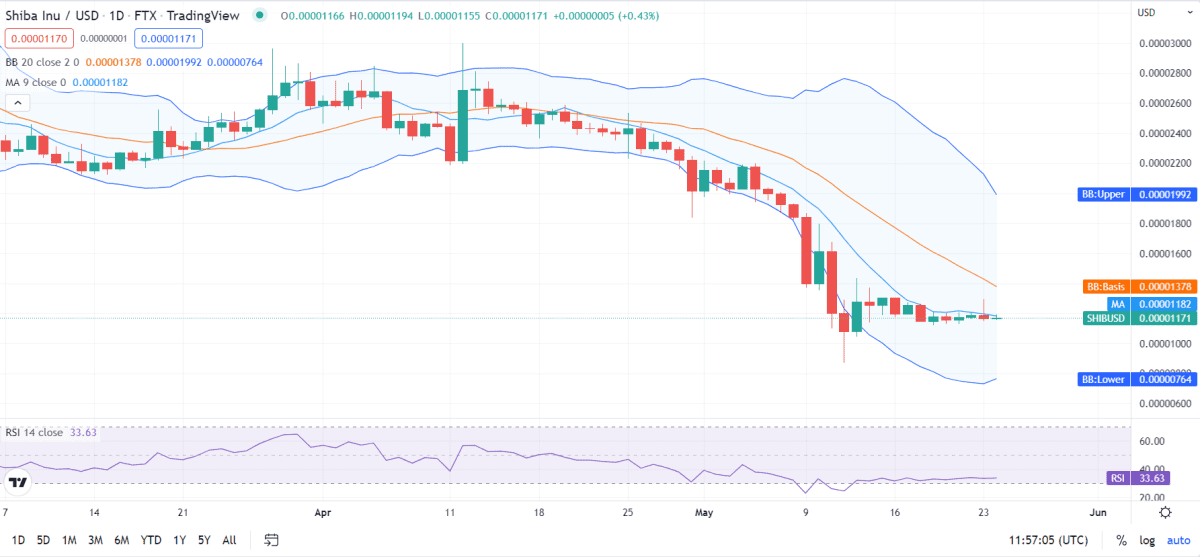
Shiba Inu price analysis reveals the Relative Strength Index (RSI) score of 33, signifying a devalued cryptocurrency. Furthermore, the RSI falls in the undervalued region. Therefore, following a linear approach signals constant characteristics and represents the selling activity equaling the buying activity, causing the RSI score to remain dormant.
Shiba Inu Price Analysis Conclusion
Shiba Inu price analysis reveals the market to have entered a complete bearish movement, showing room for future depreciation of Shiba Inu. Furthermore, the bears currently dominate the market and are likely to maintain it. As a result, the market offers massive room for further declining activity, which could destabilize SHIB and lose more value. However, since the market might break soon, we can assume that the bulls will take care of the market soon.
Disclaimer. The information provided is not trading advice. Cryptopolitan.com holds no liability for any investments made based on the information provided on this page. We strongly recommend independent research and/or consultation with a qualified professional before making any investment decisions.