Holochain is a public blockchain network that facilitates the creation of fast, hack-free, reliable, and peer-reviewed decentralized applications. It is a serverless ecosystem that connects user devices within a safe network. Thus, users can access both locally installed and cloud software. HOT is the native token of this network and its technical analysis is as follows:
Past Performance
On May 19, 2021, HOT opened at $0.01. On May 25, 2021, HOT closed at $0.009. Thus, in the past week, the HOT price has decreased by roughly 10%. In the last 24 hours, HOT has traded between $0.0091-$0.0099.
https://s3.tradingview.com/snapshots/v/vRBZvu7n.png
Day-Ahead and Tomorrow
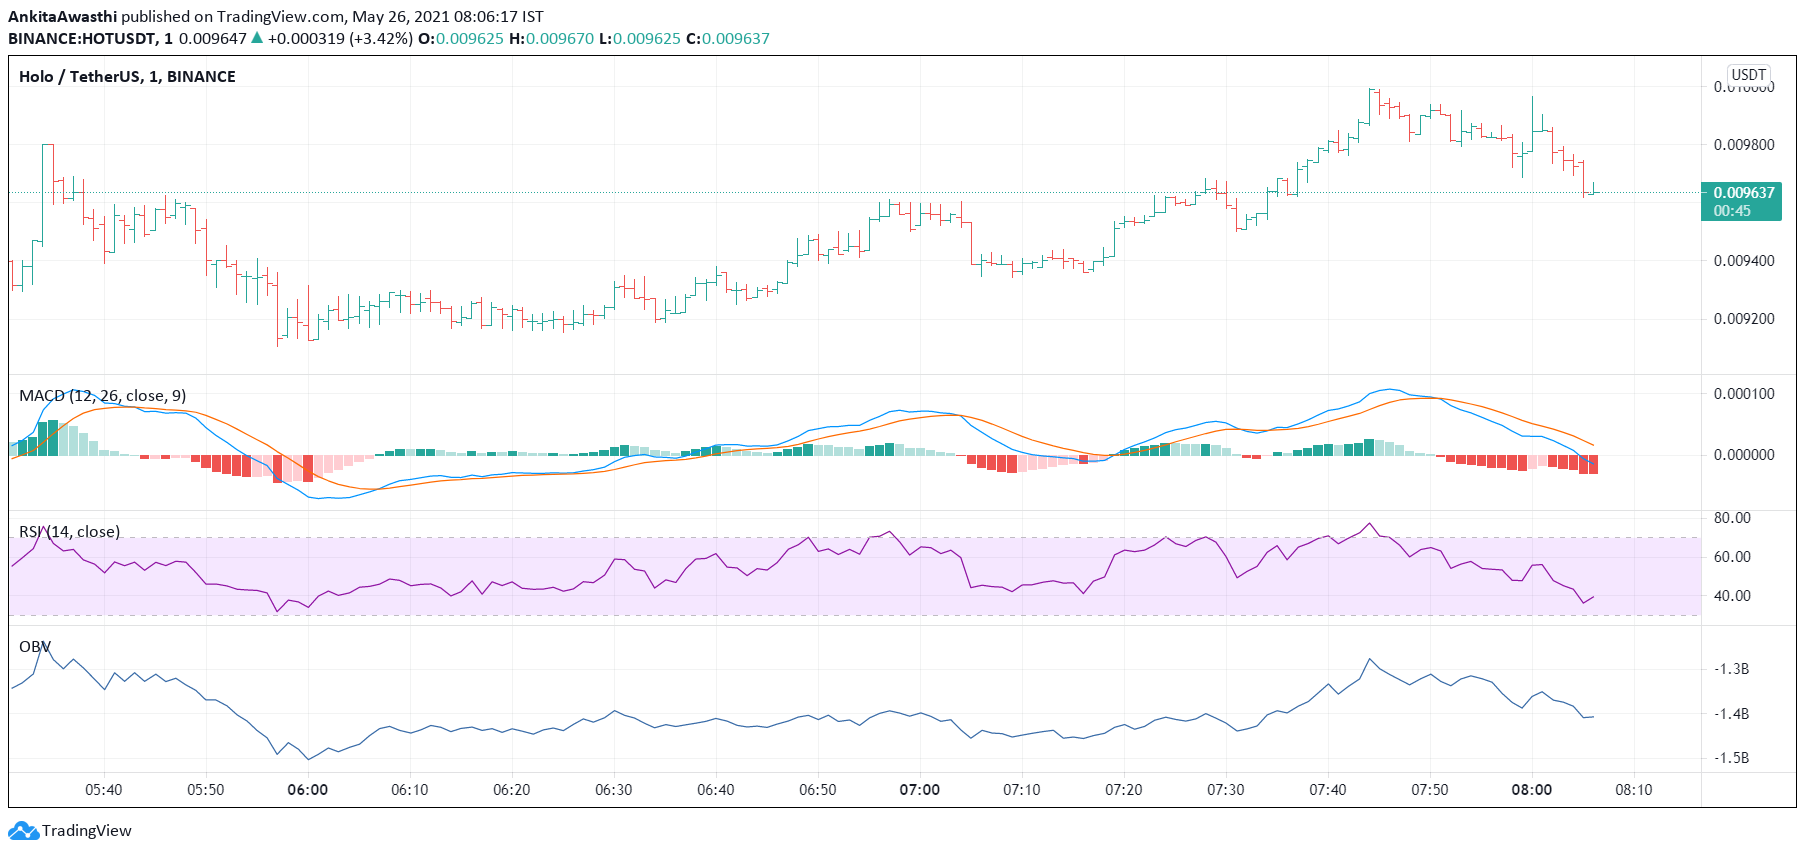
Currently, HOT is trading at $0.0096. The price has increased from the day’s opening price of $0.0093. Thus, the market seems to be bullish.
The MACD and signal lines have just turned negative. Moreover, a bearish crossover by the MACD line over the signal line has occurred. Thus, the overall market momentum has turned bearish. Hence, the price may start declining soon.
Currently, the RSI indicator is at 40%. It faced rejection at 35% and rose to the current level. However, selling pressures are still higher than buying pressures. High selling activity will exert downward pressure on the HOT price.
Besides, the OBV indicator has started declining steadily. Hence, selling volumes are higher than buying volumes. Thus, like the MACD and RSI oscillators, the OBV indicator has also given bearish signals. Therefore, the overall market momentum is negative, and the price is poised to start falling.
HOT Technical Analysis
Currently, the price is above the Fibonacci pivot point of $0.0094. It may soon fall below the pivot point and further below the first support level of $0.0091. If the bears remain strong till day end, then the price is likely to fall below the subsequent support levels of $0.0089 and $0.0086, respectively.
Presently, the price has tested and fallen below the 50% FIB retracement level of $0.0095. By day end, if the price falls below the 138.2% FIB retracement level of $0.0088, then the bearish trend is strong enough to sustain till tomorrow as well.