Polkadot price analysis illustrates DOT price market is bullish and the prices are currently up by 4.01 percent. The current trading price is $10.10 after closing yesterday’s chart in a green candlestick. The highest point DOT has reached today is $10.14 and the lowest has been $9.69. The trading volume over a 24-hour period is $426,421,559.38 and the market capitalization is$9,939,250,486.01 as of press time.DOT is currently dominating 0.79 percent while it ranks at position 11 in the digital assets market.
DOT/USD 1-day price analysis: DOT set to resume its upward trend
Polkadot price analysis in the daily price chart indicates the prices are set to follow a bullish trend in the market. After a brief consolidation phase, DOT prices have resumed their upward trend as shown by the DOT market analysis. The current trading price is $10.09 and the candlestick is likely to close in green. The support levels are present at $7.32 and $8.60 while the resistance levels are at $11.00 and $12.42.
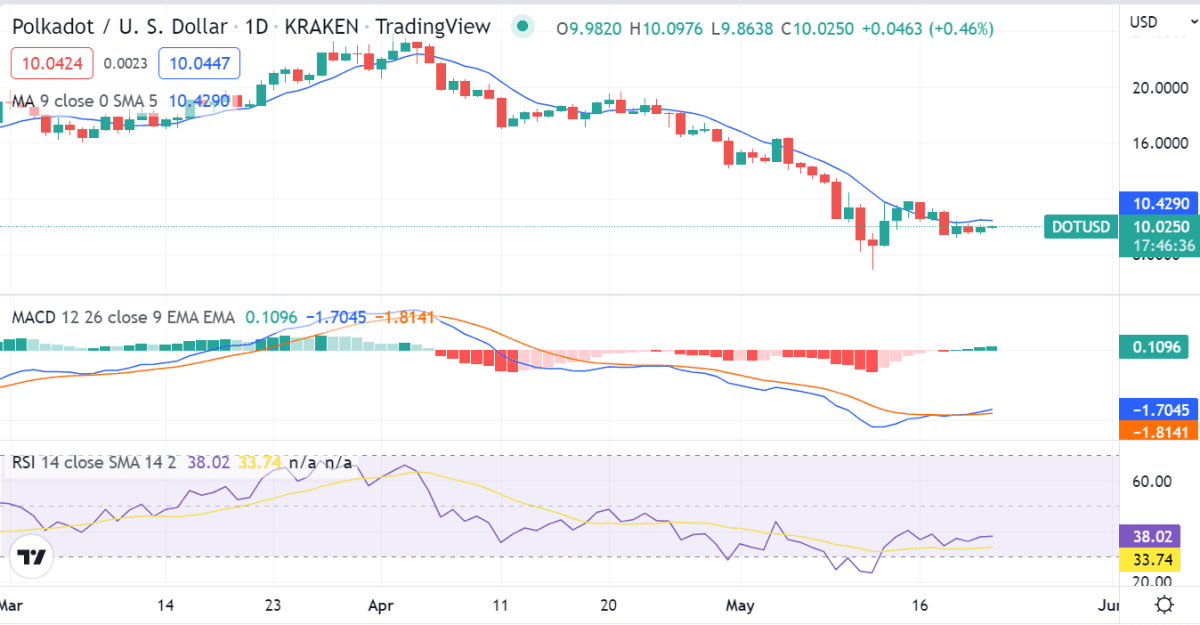
The Relative Strength Index is at 55.18 which represents a neutral zone. The prices have more room for an upward movement as the MACD line is above the signal line. The Simple Moving Average 10-day and 20-day are at $9.68 and $9.40 respectively which represents a bullish trend in the market as the prices are trading above both moving averages.
Polkadot price analysis on a 4-hour price chart: Bullish run incoming?
Polkadot price analysis on a 4-hourly timeframe indicates the buying pressure in the market is increasing. The current trading price is $10.11 and the candlestick is likely to close in green. As per the DOT market analysis, the prices have breached past the resistance level of $9.90 and are heading towards the next resistance level of $10.50. The market volatility is however low as the Bollinger Bands have narrowed.
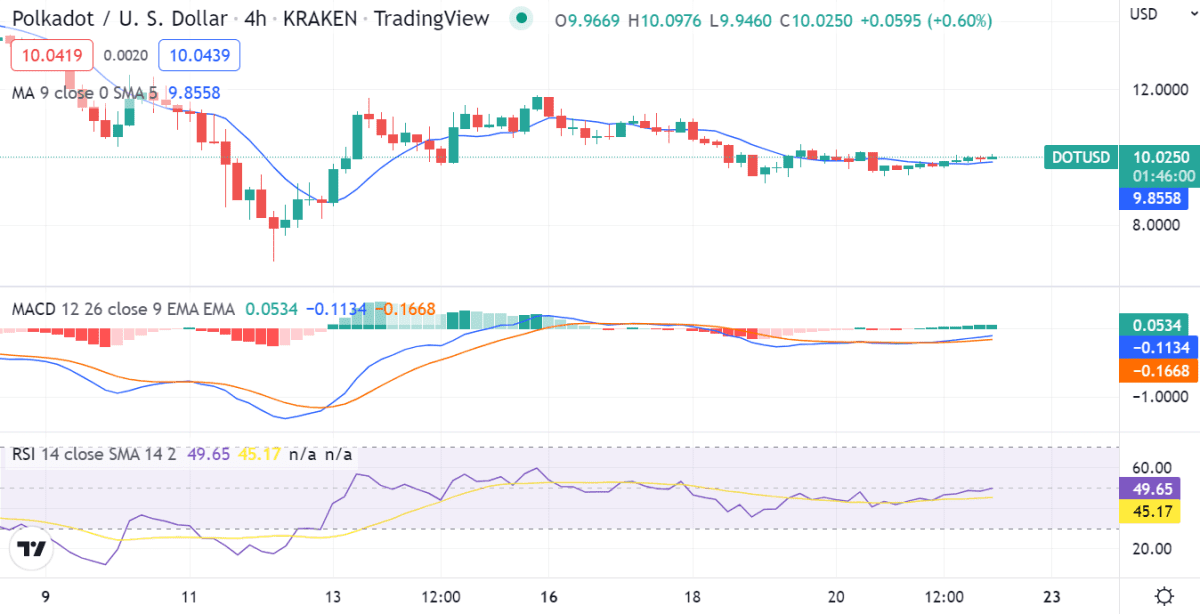
The prices are expected to rise further in the market as shown by the Relative Strength Index which is at 65.09 and represents the overbought zone. The MACD indicator is crossing the signal line from below which represents an increase in the buying pressure.
The moving averages also indicate a bullish trend as the 10-day SMA is above the 20-day SMA. The prices are expected to test the resistance levels of $10.50 and $11 in the upcoming sessions.
Polkadot price analysis conclusion
Polkadot price analysis indicates that the market is currently in a bullish trend. DOT prices are expected to test the resistance levels of $10.50 and $11 in the near future. The support levels are present at $7.32 and $8.60.
The market indicators such as the MACD and the RSI are also in favor of a bullish trend. The moving averages also support the bullish trend in the market. However, investors should exercise caution as the prices might correct lower in the short-term before resuming their upward trend.
Disclaimer. The information provided is not trading advice. Cryptopolitan.com holds no liability for any investments made based on the information provided on this page. We strongly recommend independent research and/or consultation with a qualified professional before making any investment decisions.