This week started with all cryptocurrencies taking the bull’s street, with a majority of them growing in double digits. Even the top digital currencies such as Bitcoin, XRP, Ethereum, Litecoin, and Tron saw an upsurge in their price.
According to CoinMarketCap, at press time, Tron was trading at $0.0143 with a market cap of $951.34 million. The coin has a trading volume of $92.61 million and has surged by more than 7% in the past seven days.
1-hour
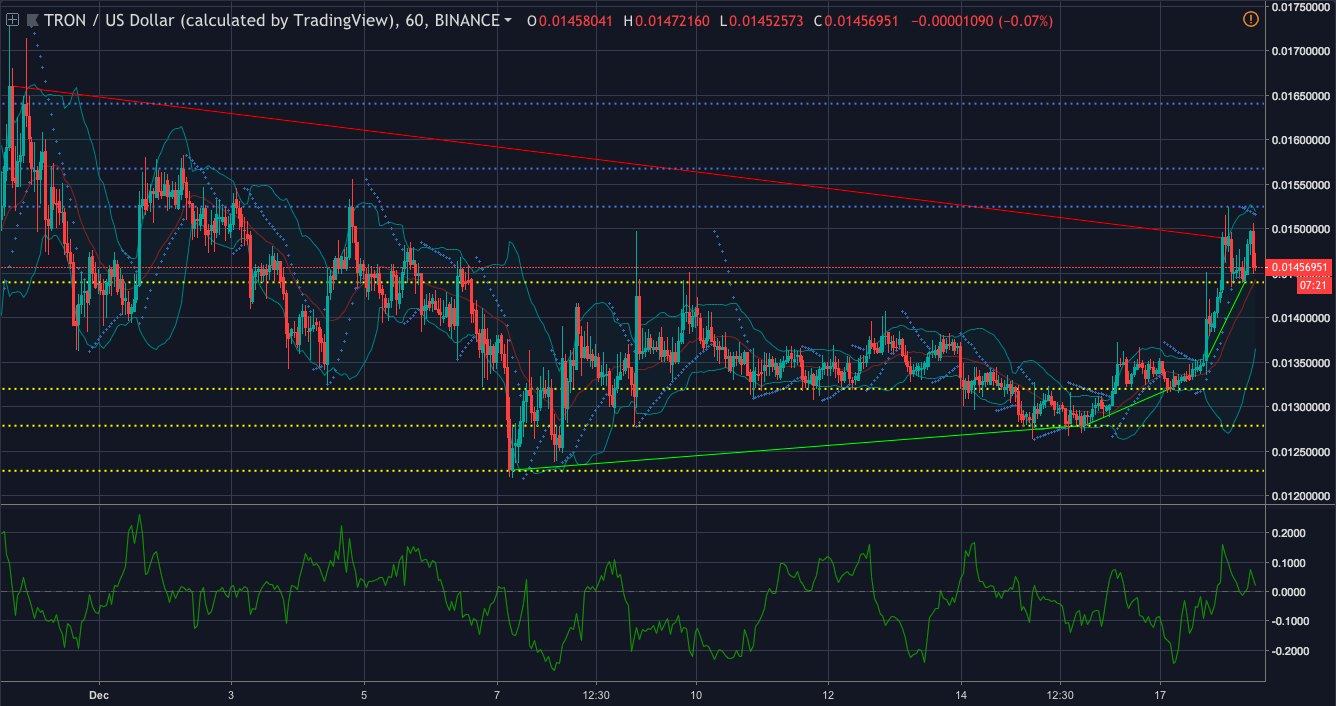
Tron one-hour price chart | Source: Trading View
In the one-hour chart, the coin has a downtrend from $0.0166 to $0.0148. It also demonstrates an uptrend from $0.0122 to $0.0127. The cryptocurrency records another uptrend from $0.0135 to $0.0144.
The immediate resistance is set at $0.0152 and the strong resistance $0.0164. The chart pictures an immediate support at $0.0143 and a strong support $0.0122.
Parabolic SAR is forecasting a bearish trend as the dots have aligned above the candlesticks.
Chaikin Money Flow, on the other hand, is showing a bullish wave as the money has started to flow into the market.
Bollinger Bands are pictured expanding, predicting a more volatile market for the coin.
1-day
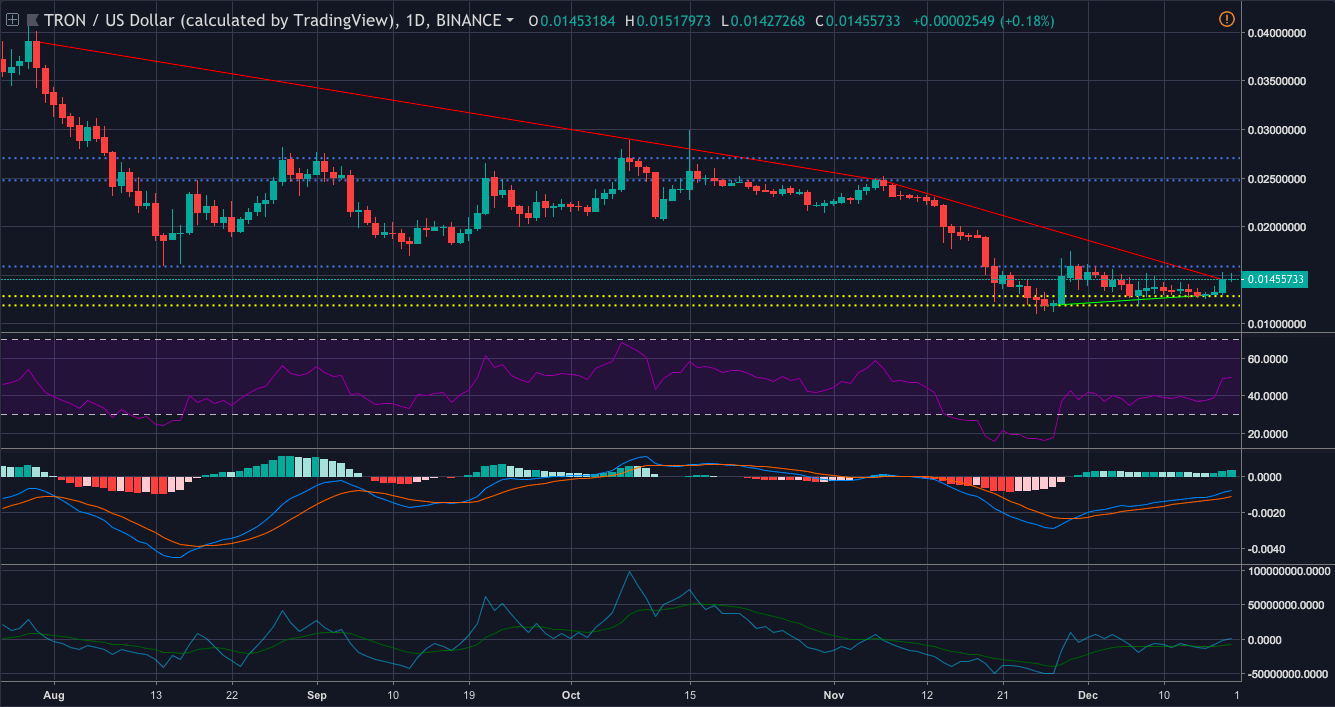
Tron one-day price chart | Source: Trading View
In the one-day chart, the cryptocurrency shows a downtrend from $0.0390 to $0.0247 and settled at $0.0145. The coin has an uptrend from $0.o119 to $0.0129.
The immediate resistance for the coin is at $0.0158 and the strong resistance is at $0.0247. The coin has found an immediate support ground at $0.0128 and the strong support level at $0.0118
MACD indicator has pictured the moving average line making a bullish crossover.
RSI is showing that the buying pressure and the selling pressure for the coin are currently evened out in the market.
Klinger Oscillator indicates the reading line making a bullish crossover.
Conclusion
The coin shows that CMF from the one-hour. chart, and Klinger Oscillator and MACD from the one-day chart have decided to walk towards the bull’s market. However, Parabolic SAR has chosen to walk towards the bear.