Uniswap price analysis indicates UNI opened the daily trading session trading at intraday highs of $4.89 as bulls looked to continue the UNI/USD pair’s recent journey north. The first few hours of the session were very much in favor of the bulls as prices climbed higher and higher, reaching an intraday high of $5.39 before pullbacks set in. However, the bears were unable to take control of the market and prices quickly recovered, eventually setting a new intraday high of $5.37.
Uniswap price movement in the last 24 hours: prices set to spike higher
Uniswap price analysis shows in the last 24 hours UNI prices have been trading in a range of $5.38 to $4.77 as the digital asset gains 10.35 percent. The prices are eying to break the $6 barrier, however, it is currently finding some resistance at $5.95. The Relative Strength Index is currently trading in the overbought region above 70 levels after rising from the support at 50 levels.
The MACD shows that UNI prices are in a bullish trend as the signal line moves above the histogram. The trading volume is currently at $158,395,720.27 as there is a strong buying action in the market. The market volatility is now rising as the Bollinger bands are now widening.
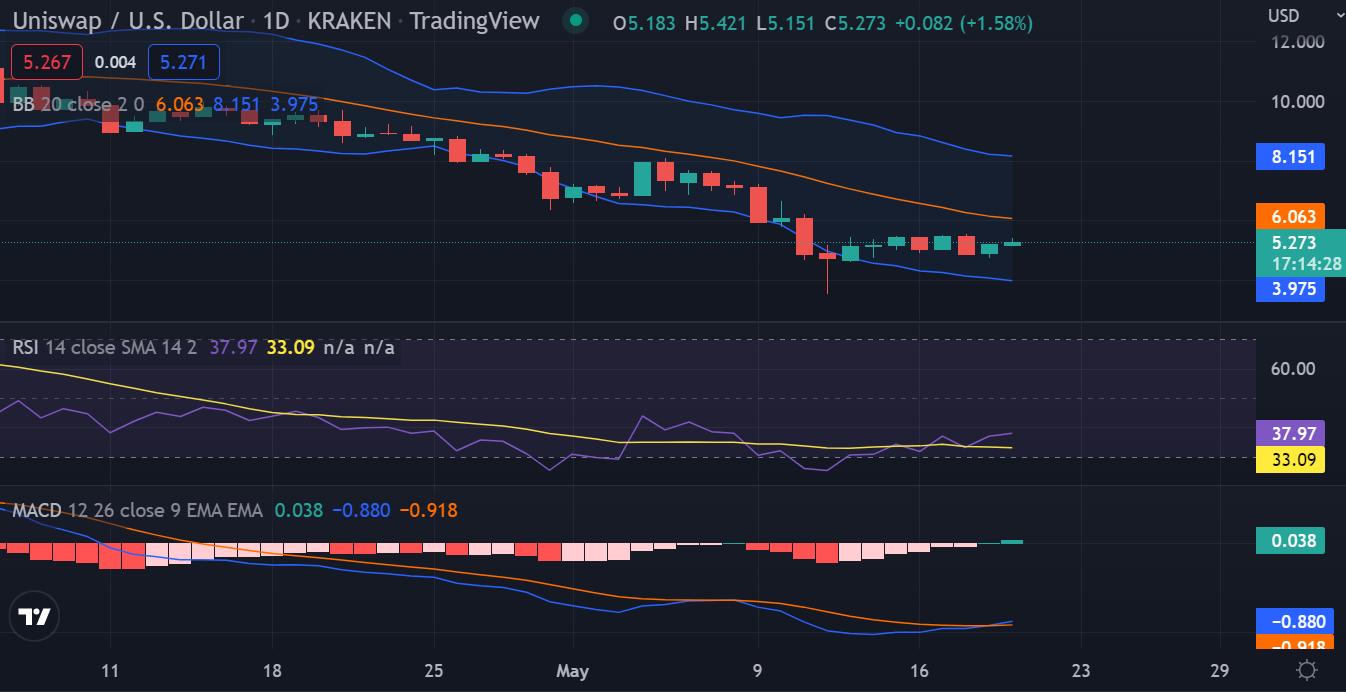
Prices are expected to continue rising in the near term as bulls look to take control of the market. However, if prices start to pull back, then support is present at $4.50 and $3.90 levels. The RSI indicator is currently residing in the bought territory, which might result in a price consolidation in the near term before resuming the uptrend.
Uniswap price analysis on a 4-hour timeframe: UNI/USD pair set to resume its uptrend
Uniswap price analysis shows UNI prices are expected to bounce back to their previous highs as the 4-hour timeframe shows that the UNI/USD pair is currently trading in a range. The digital asset is currently testing the resistance at $5.50 and a breakout above this level could see prices move higher to target the $6.00 level.
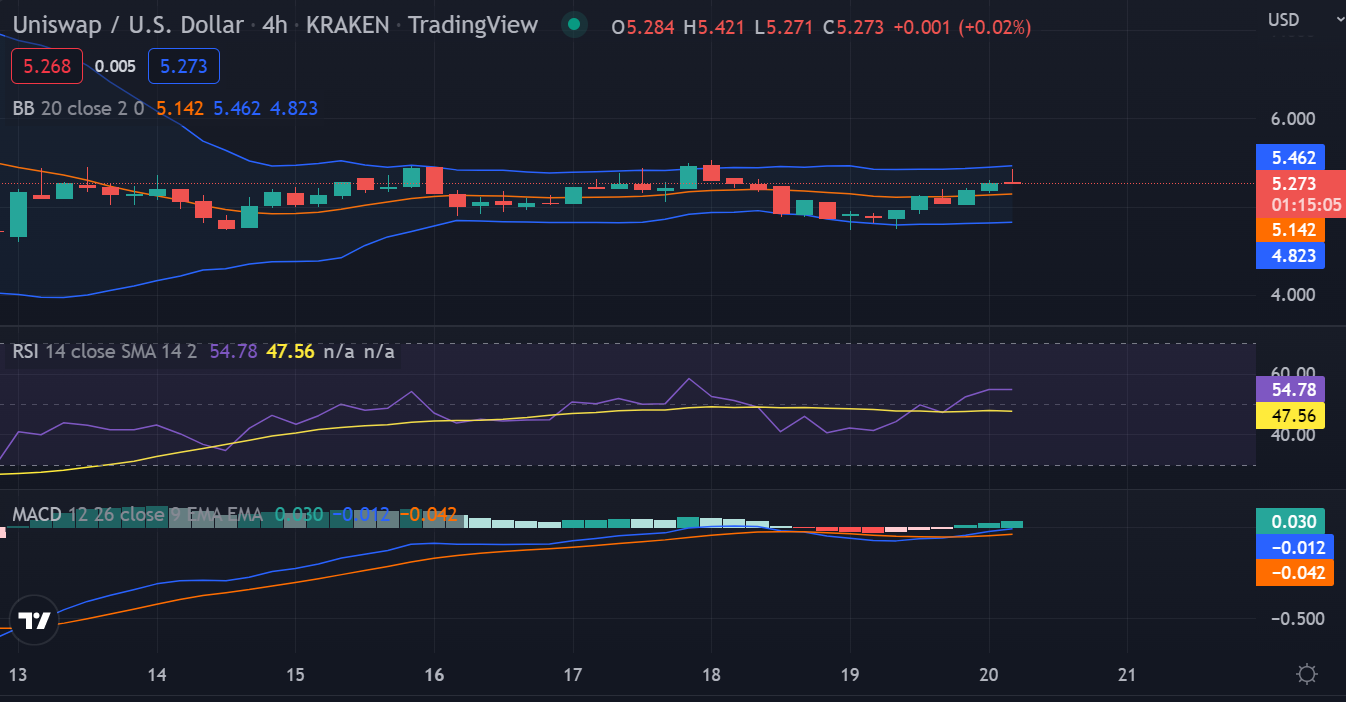
The RSI indicator is currently trading in the overbought region, resting at 71.46 levels, and is expected to remain in this region for some time as prices continue to move higher. The market volatility is relatively low on the 4-hour price chart as indicated by the narrowing of the Bollinger bands. The prices seem to be in a consolidation phase as the MACD shows that the signal line is moving below the histogram. The trading volume is currently at $107,909,734.09 and is expected to rise in the coming days as prices move higher.
Uniswap price analysis conclusion
Uniswap price analysis for today indicates the market is in a bullish trend as the UNI/USD pair looks to resume its uptrend. Prices are currently testing the resistance at $5.50 and a breakout above this level could see prices move higher to target the $6.00 level. The key resistance levels to watch out for are $6.00 and $6.50 levels. Support levels are at $4.50 and $3.90 levels. If these resistance levels are broken, then prices could move higher to target the $7.00 level.
Disclaimer. The information provided is not trading advice. Cryptopolitan.com holds no liability for any investments made based on the information provided on this page. We strongly recommend independent research and/or consultation with a qualified professional before making any investment decisions.