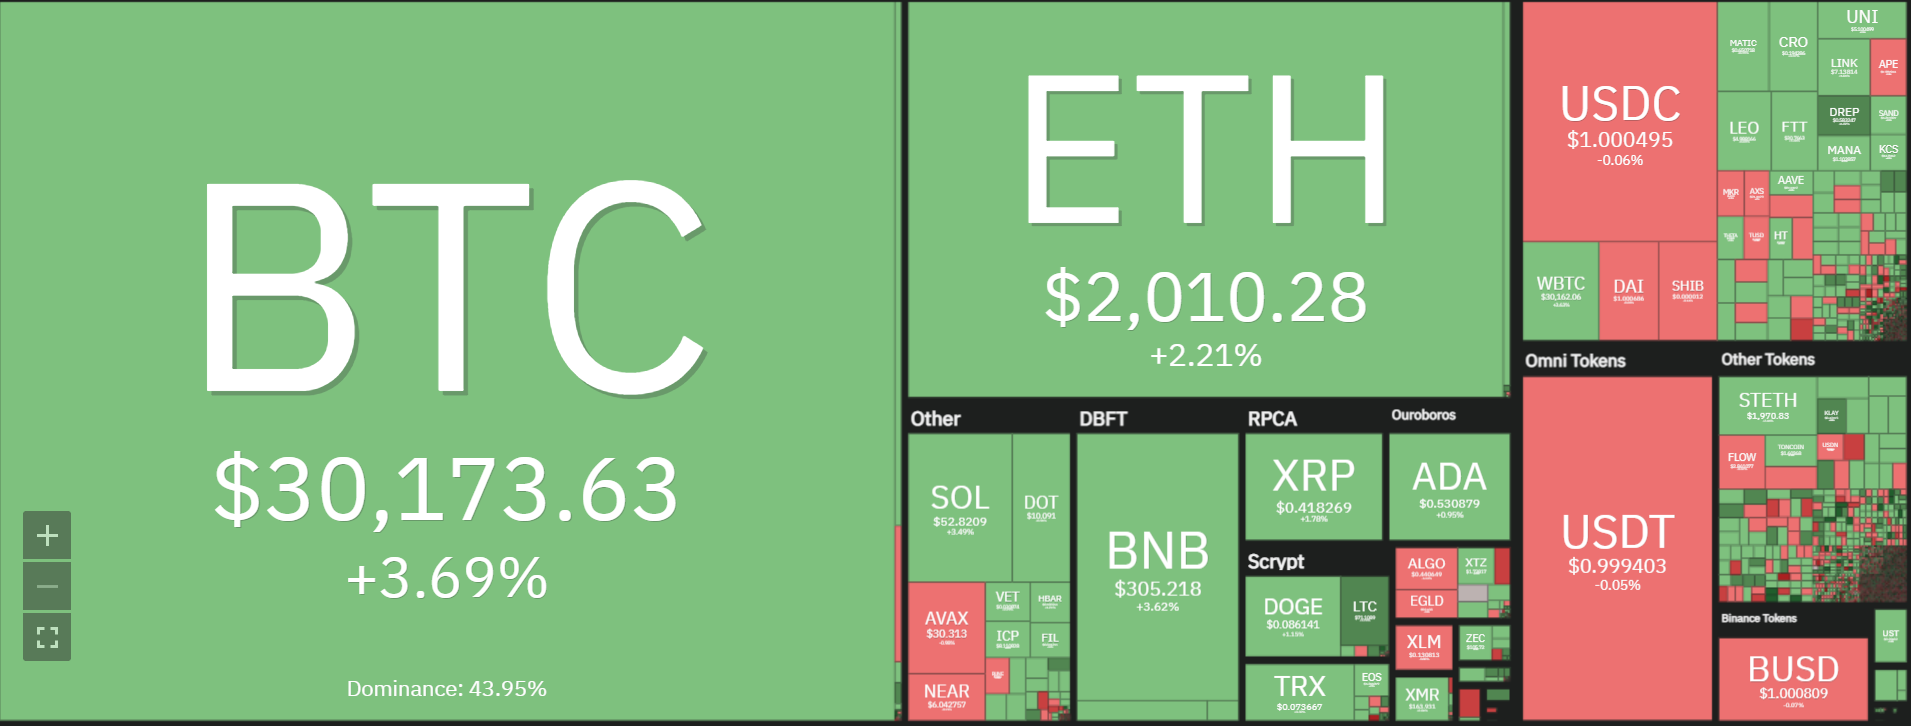
Apecoin price analysis indicates that APE has completed the day on a bullish trend as the coin currently trades at $8. The market capitalization of the coin is $2.3billion, and its trading volume in the last 24 hours is recorded at $593 million. The coin has gained by 1.26 percent in the last 24 hours.
Apecoin started the day trading at $7.8, and it reached a high of $7.9 before it faced rejection and dropped to a low of $7.47. The coin has found minor support at this level as it started to recover and currently trades around $8.The APE/USD pair ranks at position 32 according to the CoinMarketCap data.
The immediate resistance for the coin lies at $8.6, and if the bulls can push the price above this level, we can expect the price to rally towards $9. The next major resistance lies at $9.2. On the downside, support lies at $7.47, and a break below this level can result in a sell-off towards $6.8.
Apecoin price analysis on the 24-hour price chart: APE bulls aim $9
Apecoin price analysis in a 1-day price chart shows that the bulls have been in control of the market since yesterday as the price has been trading above the moving averages. The moving average convergence divergence (MACD) indicator shows that the MACD line is about to cross above the signal line, which indicates that the bulls are gaining momentum.
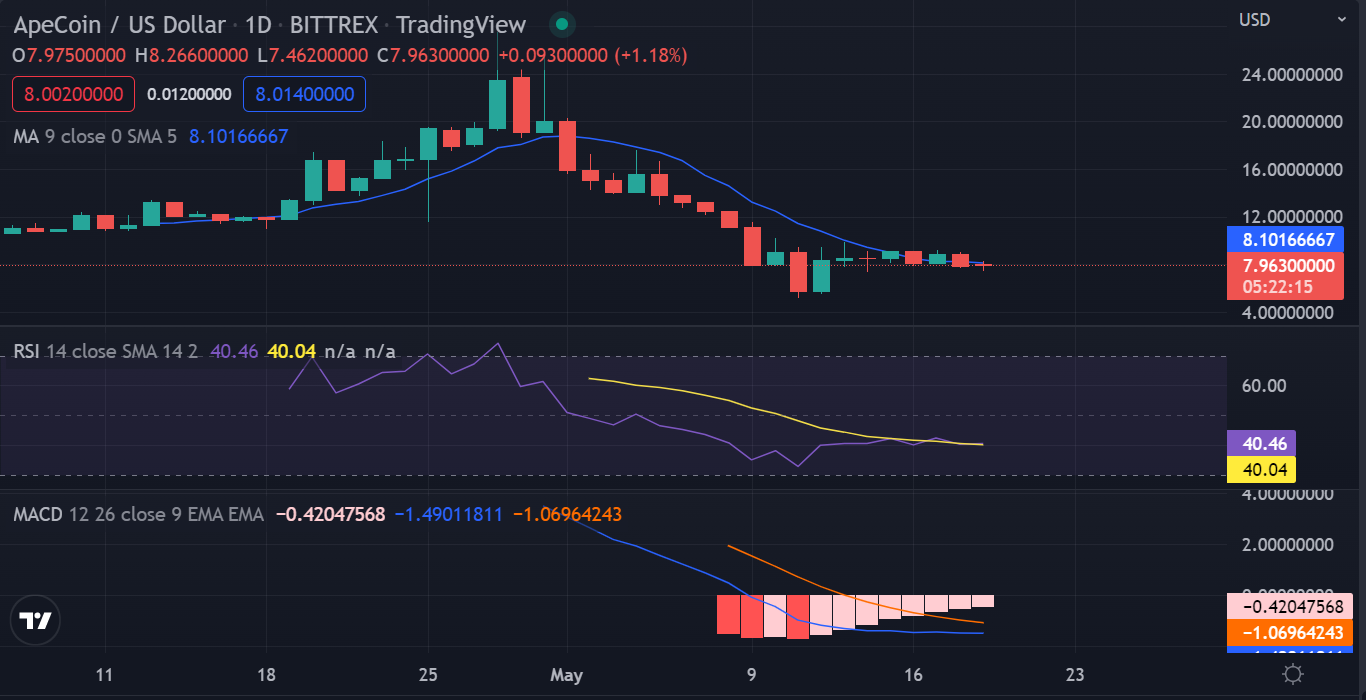
The Relative Strength Index (RSI) for APE/USDT is currently residing at $40.1 and moving towards the neutral level, which indicates that the market is in a positive trend.
APE price analysis on the 4-hour chart: APE poised for a downtrend
Apecoin price analysis on the 4-hour timeframe shows that the coin has been trading in a descending channel since it reached a high of $8.2. The price has been making higher lows and lower highs, which is a bearish sign.
The MACD indicator for APE/USDT is currently in the bearish zone as the MACD line is crossing below the graph, which indicates that the bears are taking control of the market.
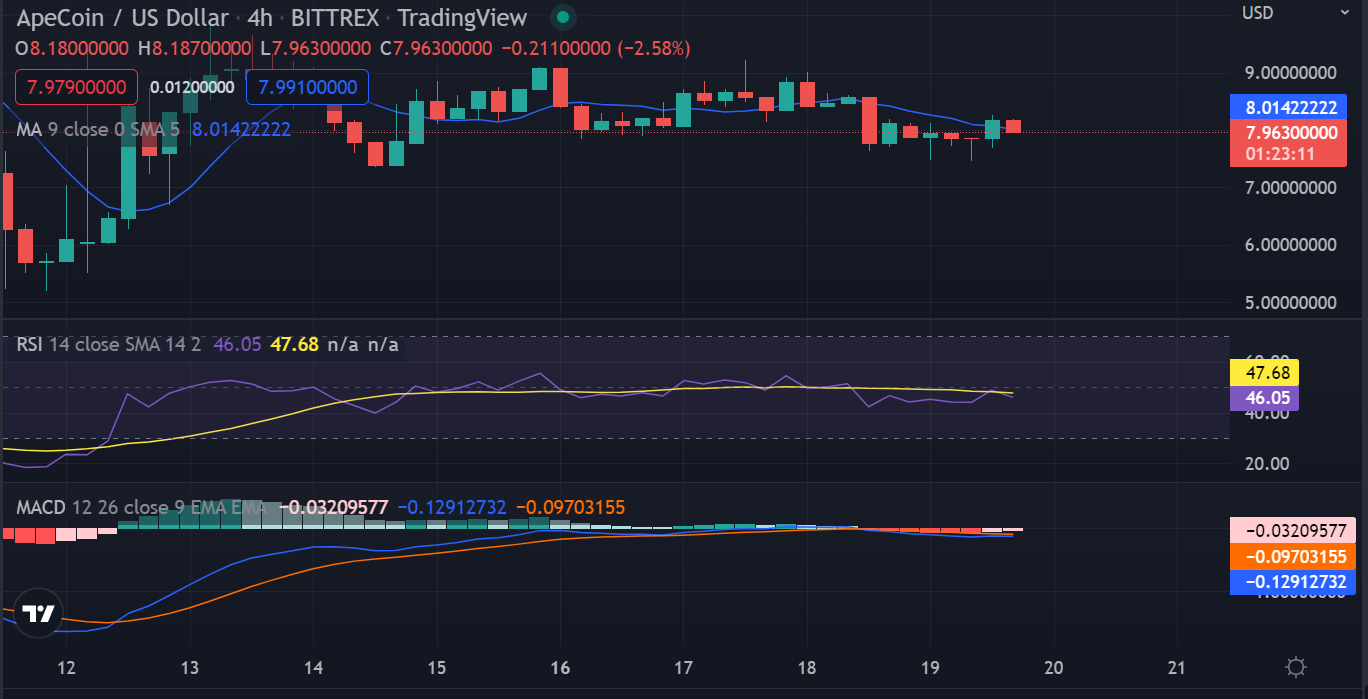
The RSI for APE/USDT is residing at $42.2, and it is below the neutral level, which indicates that the market momentum is slowly shifting in favor of the bears.
The moving average is currently located below the candlesticks, which is a bearish sign. Apecoin price analysis further suggests that the market opened at $7.40 today, and it reached a high of $8.2 before it started to decline and found support at $7.47.
Apecoin price analysis conclusion
Apecoin price analysis for today illustrates that the market opened in a bullish trend as the price reached a high of $8.2. The market then faced rejection and found support at $7.47 before it started to recover and is currently trading around $8 in the long term. The market is expected to remain range-bound between $7.47 and $8 for some time before it can make a breakout. In the short term, the market is expected to face some resistance at $8.6 and $9.2.
Disclaimer. The information provided is not trading advice. Cryptopolitan.com holds no liability for any investments made based on the information provided on this page. We strongly recommend independent research and/or consultation with a qualified professional before making any investment decisions.