BNB prices struggle to sustain above $300 and provide multiple fakeouts as buyers at $296 maintain the status quo. Is the status quo soon to turn bearish? Key technical points:
- BNB price attempts to find closing above $296.
- The MACD indicator hints at a trend reversal.
- The 24-hour trading volume of Binance is $1.48 Billion, indicating an 8% decrease.
Past Performance of BNB
As mentioned in our previous analysis, BNB prices surpass the falling channel pattern with a morning star pattern and reach the psychological mark of $300. However, the formidable sellers above the mental barrier with the lack of buyers evident by the loss in trading volume lower the chances of a prolonged uptrend. 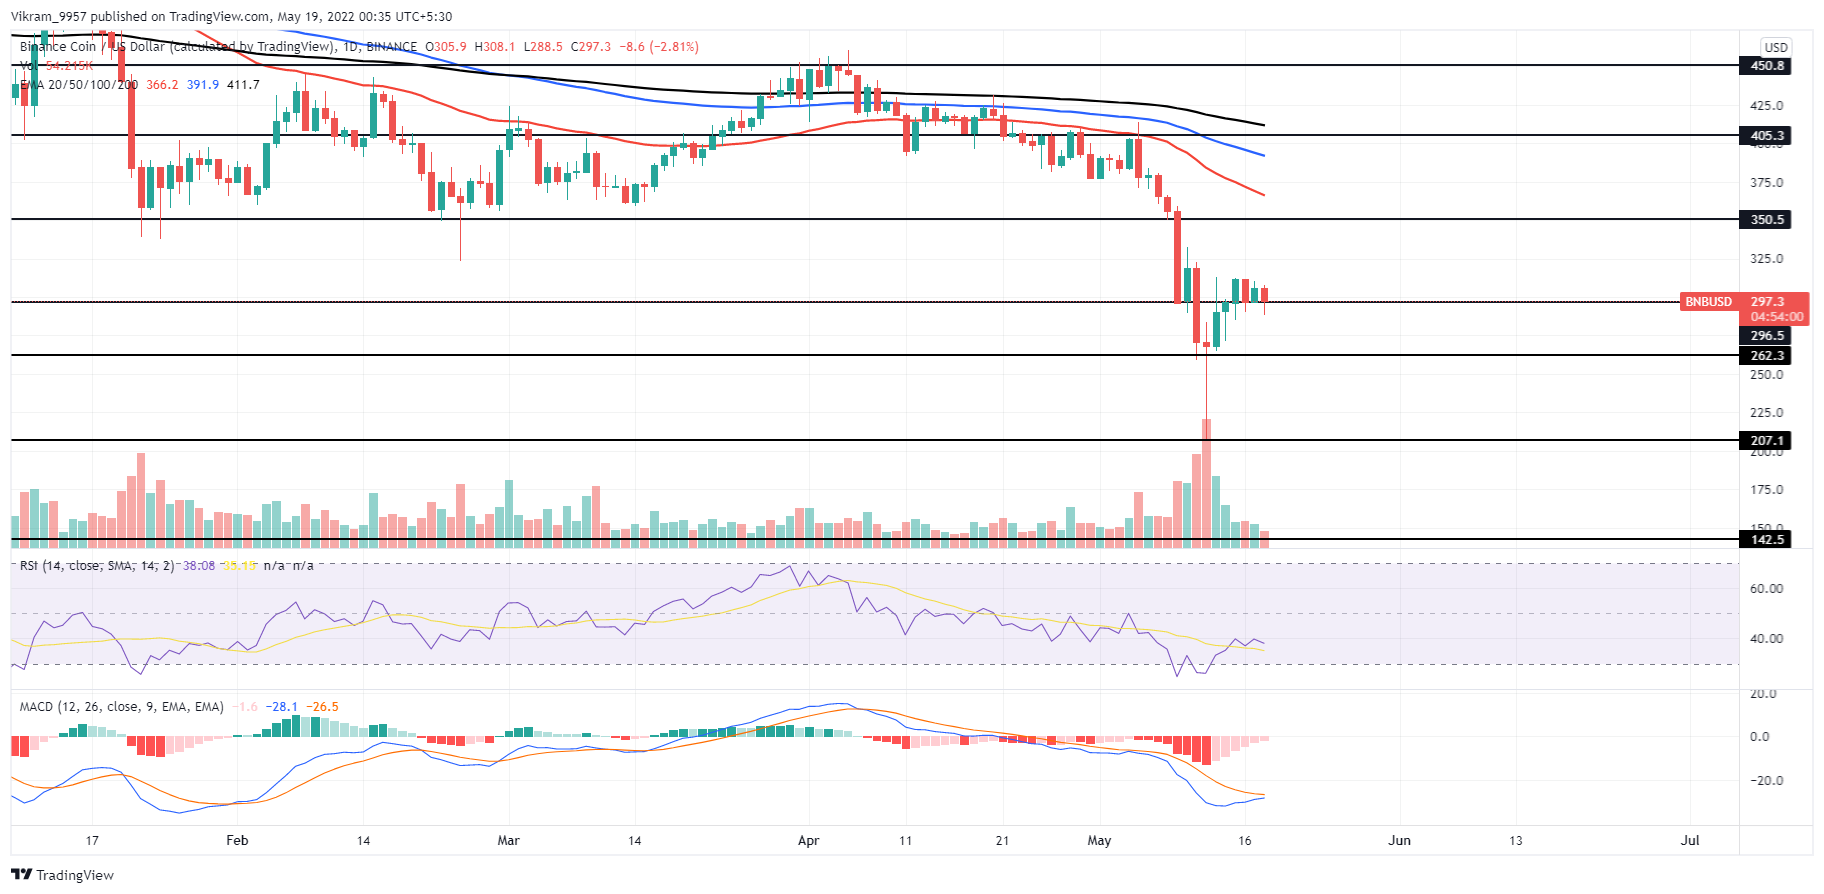 Source-Tradingview
BNB Technical Analysis
The reversal in BNB prices from $265 to $300 will be in vain if the sellers at the mental barrier overtake the trend control and push it back under. Furthermore, the upcoming bearish reversal may find increased commitment and crack the $250 mark. The downfall observed between late April and the early two weeks of May increased the bearish spread among the falling crucial EMAs. This reflects an increase in the underlying bearishness and the number of resistances for the uptrend to break for sustenance. The bullish reversal in RSI values from the oversold territory surpasses the 14-day SM(yellow) but struggles to approach the halfway line as it discharges into the way. Hence, the fresh take of a lateral shift lowers the possibility of an uptrend continuation. The MACD and signal lines take a bullish turnaround resulting in a reversal in the fast line, which decreases the bearish spread. Hence, traders can expect a bullish crossover shortly, resulting in a fresh trend of positive histograms. In short, the BNB technical analysis depicts a bullish struggle to sustain the uptrend above $300.
Upcoming Trend
Currently, the BNB prices form a 3.37% bearish candle, but the lower price rejection remains evident, reflecting a bullish fightback to sustain the uptrend. However, traders must wait for the uptrend to close above $320 to avoid a bull trap. On the opposite end, a reversal will refuel the downtrend and increase the possibility of a $265 crackdown and reaching $250. Support Levels: $265 and $250 Resistance Levels: $320 and $350