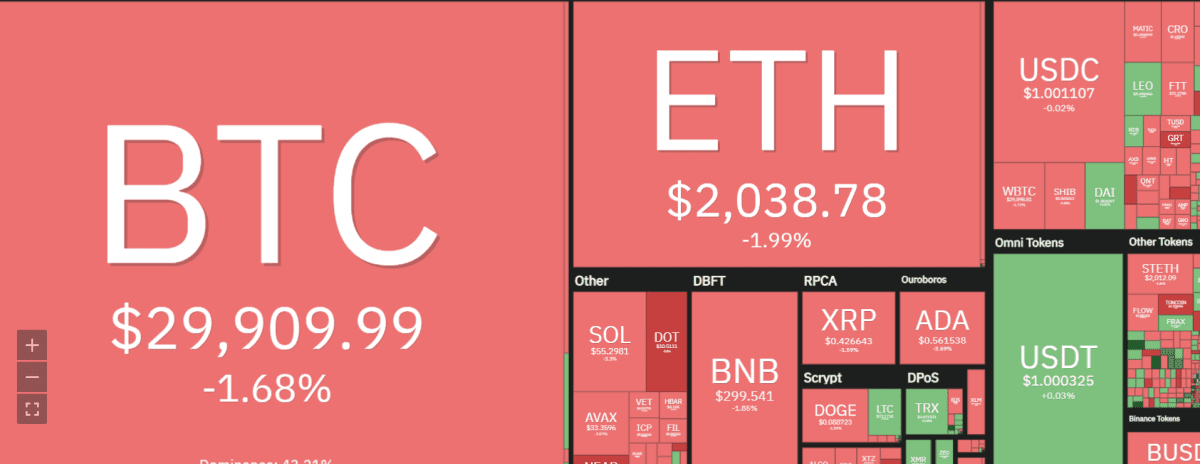
Litecoin price analysis shows the digital asset opened the daily trading session trading at $72.52.LTC closed yesterday’s trading chart with bulls in control and they are still in charge as the market surges by 2.74 percent. The trading volume for the day is still at its average and currently, it’s trading at $775,517,054.74. The total market capitalization for Litecoin stands at $5.09 billion as the digital asset currently occupies position 18 on the coin ranking chart. The digital asset has traded at a low of $70.23 and a high of $74.04 as it dominates 0.40 percent of the cryptocurrency market.
LTC/USD price analysis on a daily timeframe: Bulls push for higher prices
The 1-day Litecoin price analysis shows the bulls are stumbling to push prices higher to initiate a firm bullish momentum. Bears are still in play as the market consolidates before a break out in the next few hours. The immediate target for the bulls is to push prices and close above the descending trend line. The market volatility is also on the rise as Bollinger Bands widen. The Stochastic Oscillators have crossed to point northward indicating an upward momentum in prices.
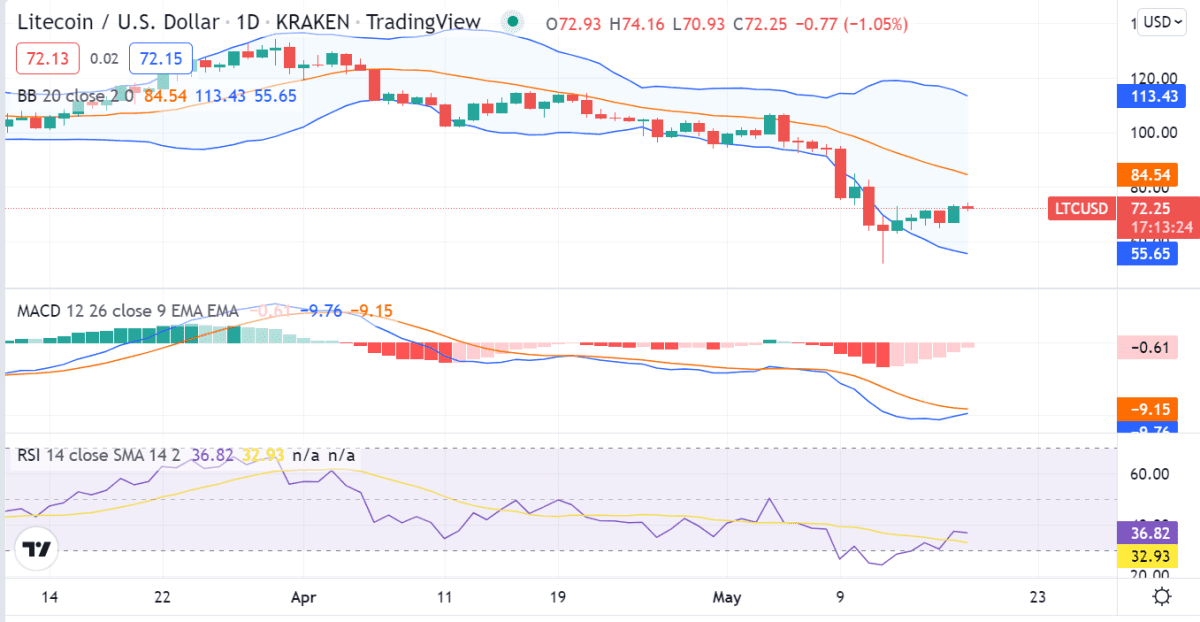
The Relative Strength Index(RSI) indicator on the 1-day timeframe is currently at 44.76 levels. This indicates that there are more sellers than buyers in the market as the digital asset fluctuates in a tight range. The MACD indicator is currently at -0.05 levels with the signal line pushing above the 12-day EMA to indicate a possible turn to bullish momentum if the market can close today’s trading session higher than the $73.0 level.
Litecoin price analysis on a 4-hour price chart: Further gains expected
The 4-hour Litecoin price analysis shows that the market opened trading at $73.37 and is currently trading at $72.90 after a slight pullback from highs of $74.03. The bulls are still in control as they target the $75 price level with more buyers joining the market. The digital asset is currently trading above the ascending trend line which is a good sign for the bulls.
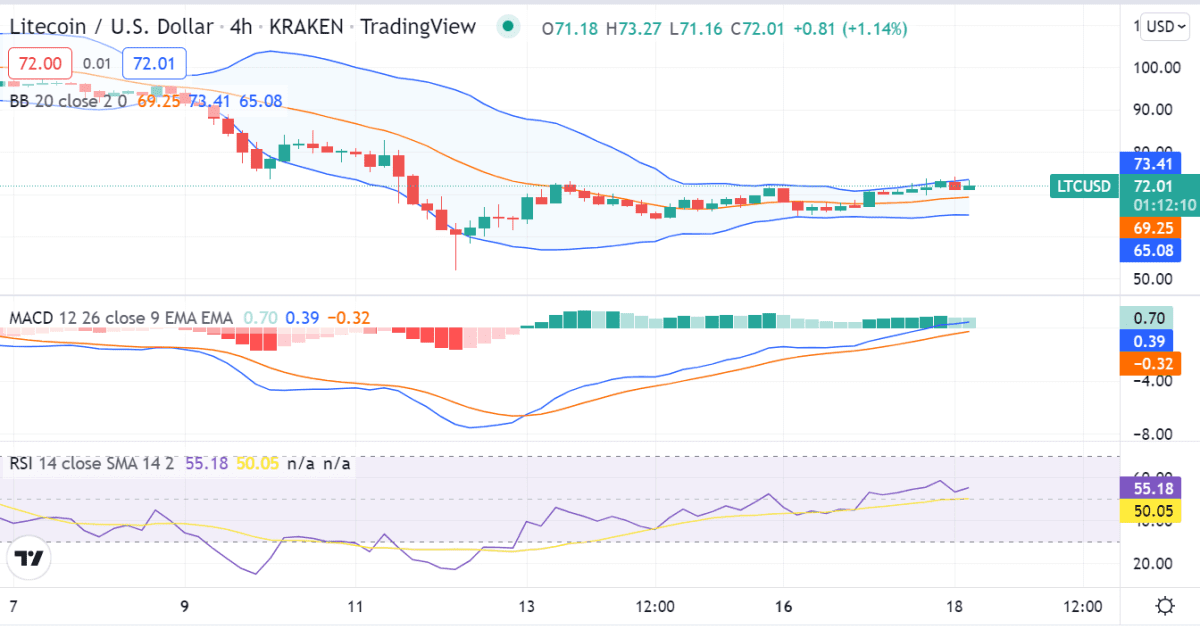
The Relative Strength Index(RSI) indicator on the 4-hour timeframe is currently at 48.83 levels. The RSI indicator is still pointing northward which indicates that there could be more gains in prices as buyers step into the market. The MACD indicator is currently at -0.04 levels with the signal line pushing above the 12-day EMA to indicate a possible turn to bullish momentum if the market can close today’s trading session higher than the $73.0 level.
Litecoin price analysis conclusion
The LTC/USD price analysis indicates that the prices are currently trading at the $71.7 level, and it looks like the bulls are in control of the market. The next few days will be crucial for Litecoin while on the downside, a move below the $70 level could see Litecoin prices retrace to the $65 level. On the upside, a move above the $72 level could see Litecoin prices target the $80 level in the near term.
Disclaimer. The information provided is not trading advice. Cryptopolitan.com holds no liability for any investments made based on the information provided on this page. We strongly recommend independent research and/or consultation with a qualified professional before making any investment decisions.