Solana price analysis recently reveals a bullish market sentiment after a slight price drop. The digital asset is currently trading at $56.21 and is facing resistance at $57.49. On the other hand, support for SOL/USD is present at $52.27.Solana prices have been trading low over the last few days but have regained bullish momentum today. The coin started the day at $54.47 and has seen a slight price increase of 3.15% since then. At the time of writing, SOL/USD is trading hands at $56.21 and is facing immediate resistance at $57.49. A break above this level could see Solana prices surge higher in the near term.
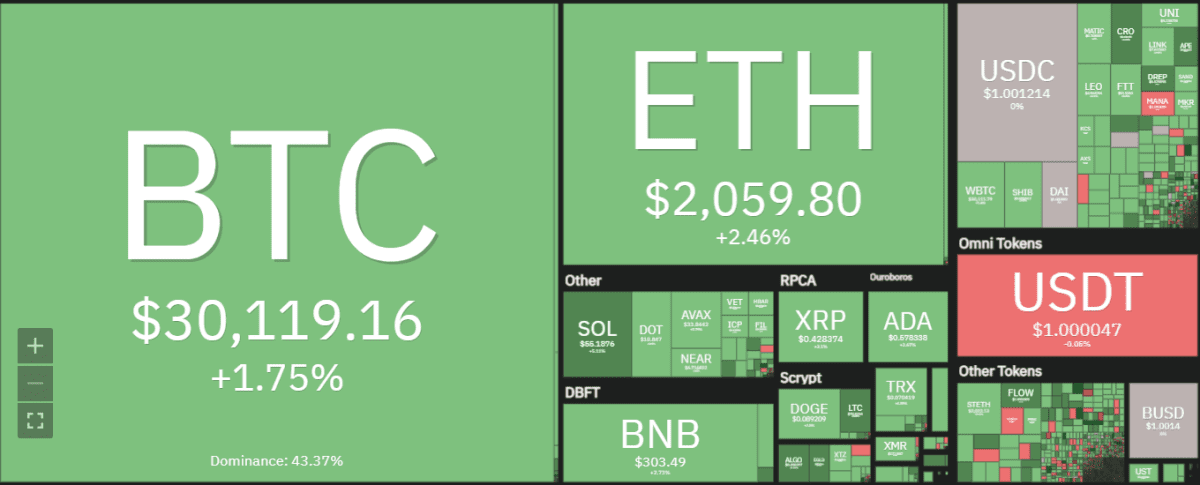
The market cap for the coin has also increased and is now worth $19,326,013,428 while the trading volume stands at $1,839,799,491. Solana’s price is expected to continue its upward trend as the bulls are in control of the market as the prices have been alternating between a range of $52 and $57.The cryptocurrency market is gradually on the rise with most of the top assets seeing gains in the past 24-hours.
Solana price action on a 1-day price chart: SOL/USD trades above $56.21
Solana price analysis on the 1-day price chart shows that SOL/USD pair has been trading with a positive bias. The pair has formed higher lows and higher highs which is a bullish sign the price action recently had a breakout above the ascending triangle pattern that had developed over the past 24 -hours which is a bullish sign.
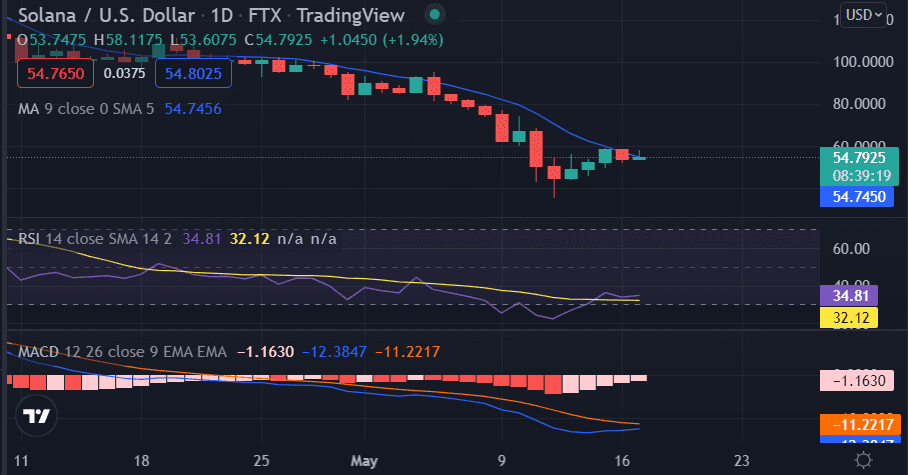
The MA 50 and MA 200 are both sloping upwards which is another bullish sign for the pair. The Relative strength index indicator is currently at 65.48 which signals that the market is currently in the overbought region but is slowly heading towards the neutral zone. The MACD indicator shows a bullish crossover as the signal line is above the histogram which suggests that the price may continue to rise in the near term.
Solana price analysis on a 4-hour price chart: SOL starts to recover after the previous loss
On the 4-hour price chart, Solana price analysis reveals that the coin had started to recover after the previous loss. The SOL/USD is currently trading at $56.21 and is facing immediate resistance at $57.49. and support for SOL/USD is present at $52.27.
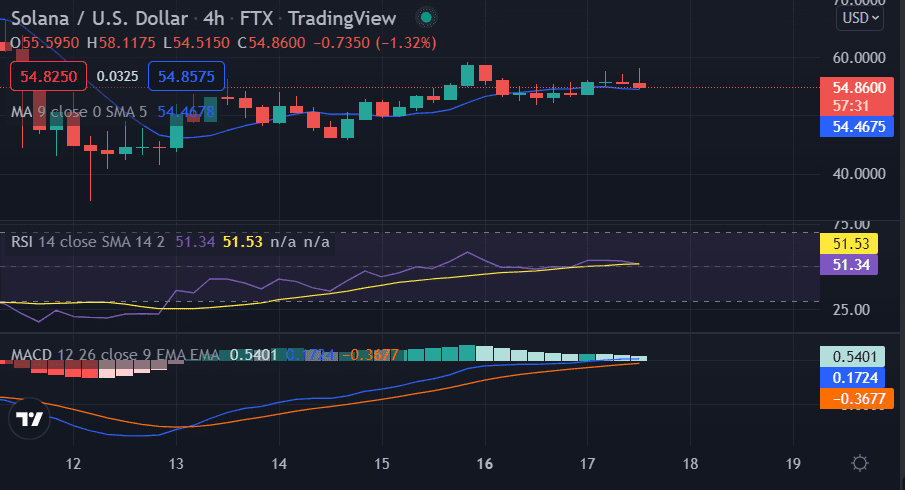
The price is currently trading above the moving averages which suggests that the market is in a bullish trend in the near term. the RSI indicator is currently at 55.32 and pointing upwards which suggests that there is still room for bulls to push prices higher in the near term. The MACD line is also above the signal line which is a bullish sign.
Solana price analysis conclusion
In conclusion, Solana price analysis on both the 1-day and 4-hour timeframe shows that the market is in a bullish trend in the near term. The technical indicators are also in favor of the bulls. So, we can expect prices to continue to rise in the near term with the next target being $57.49. The bulls are currently in control of the market as prices have been trading above the moving averages. However, investors should exercise caution as prices may correct lower in the event of a sudden sell-off.
Disclaimer. The information provided is not trading advice. Cryptopolitan.com holds no liability for any investments made based on the information provided on this page. We strongly recommend independent research and/or consultation with a qualified professional before making any investment decisions