Be[in]Crypto takes a look at the price movement for seven different cryptocurrencies, including Kava Lend (HARD), which initiated a significant upward movement on May 12.
BTC
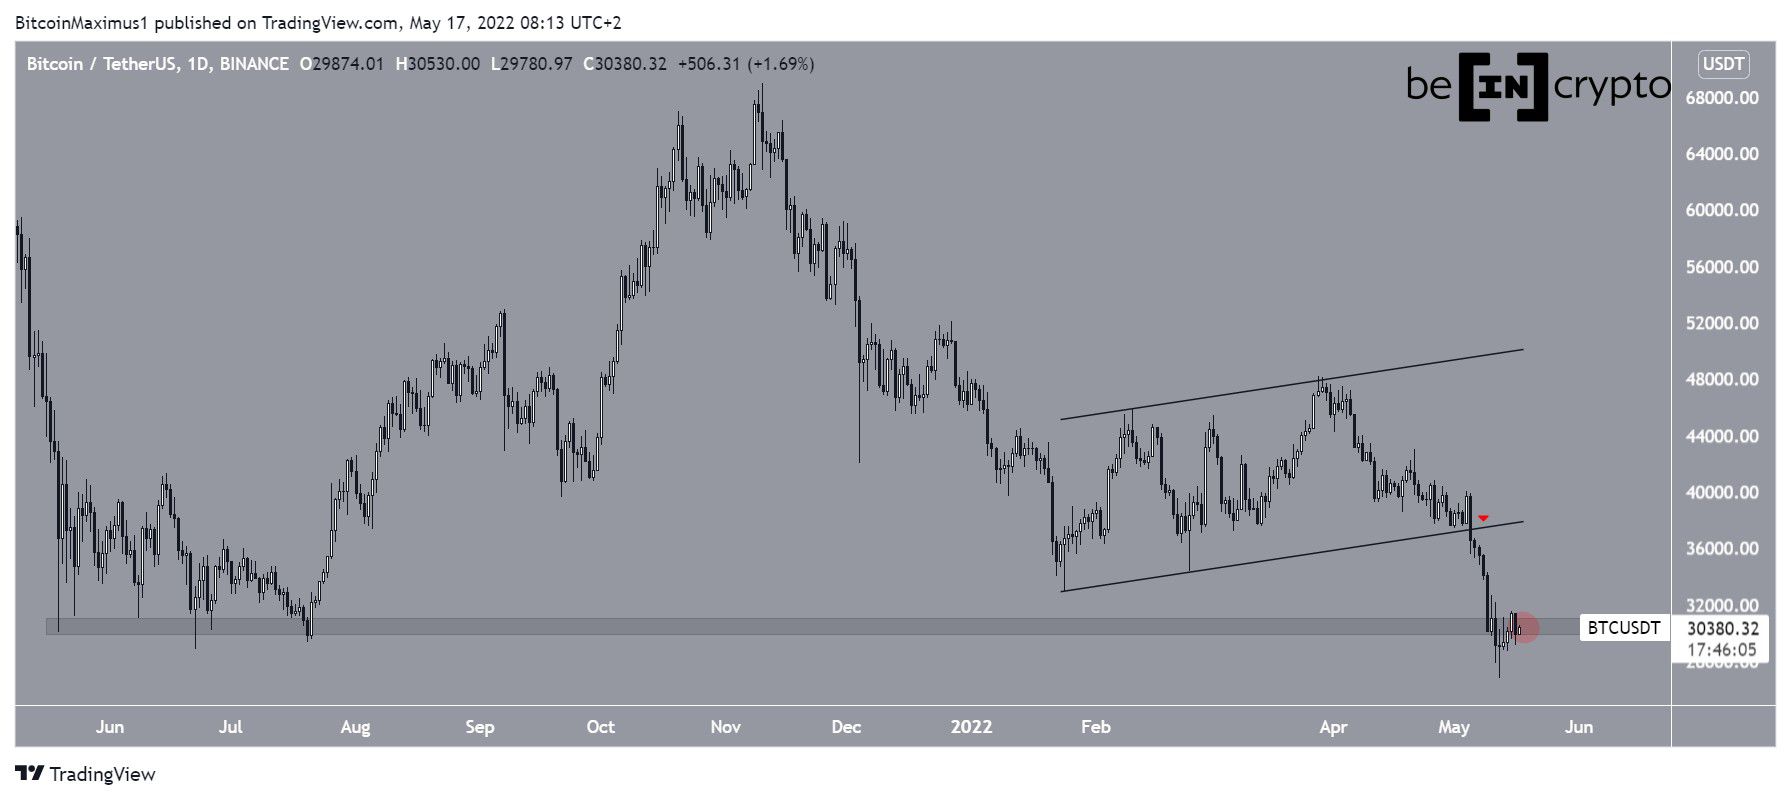
On May 5 (red icon), bitcoin (BTC) broke down from an ascending parallel channel. It proceeded to reach a low of $26,700 on May 12.
BTC bounced afterward and is currently attempting to reclaim the $30,500 horizontal area. The area had previously acted as support for nearly one year.
Therefore, whether BTC reclaims this level or gets rejected will be crucial for determining the direction of the future trend.
ETH
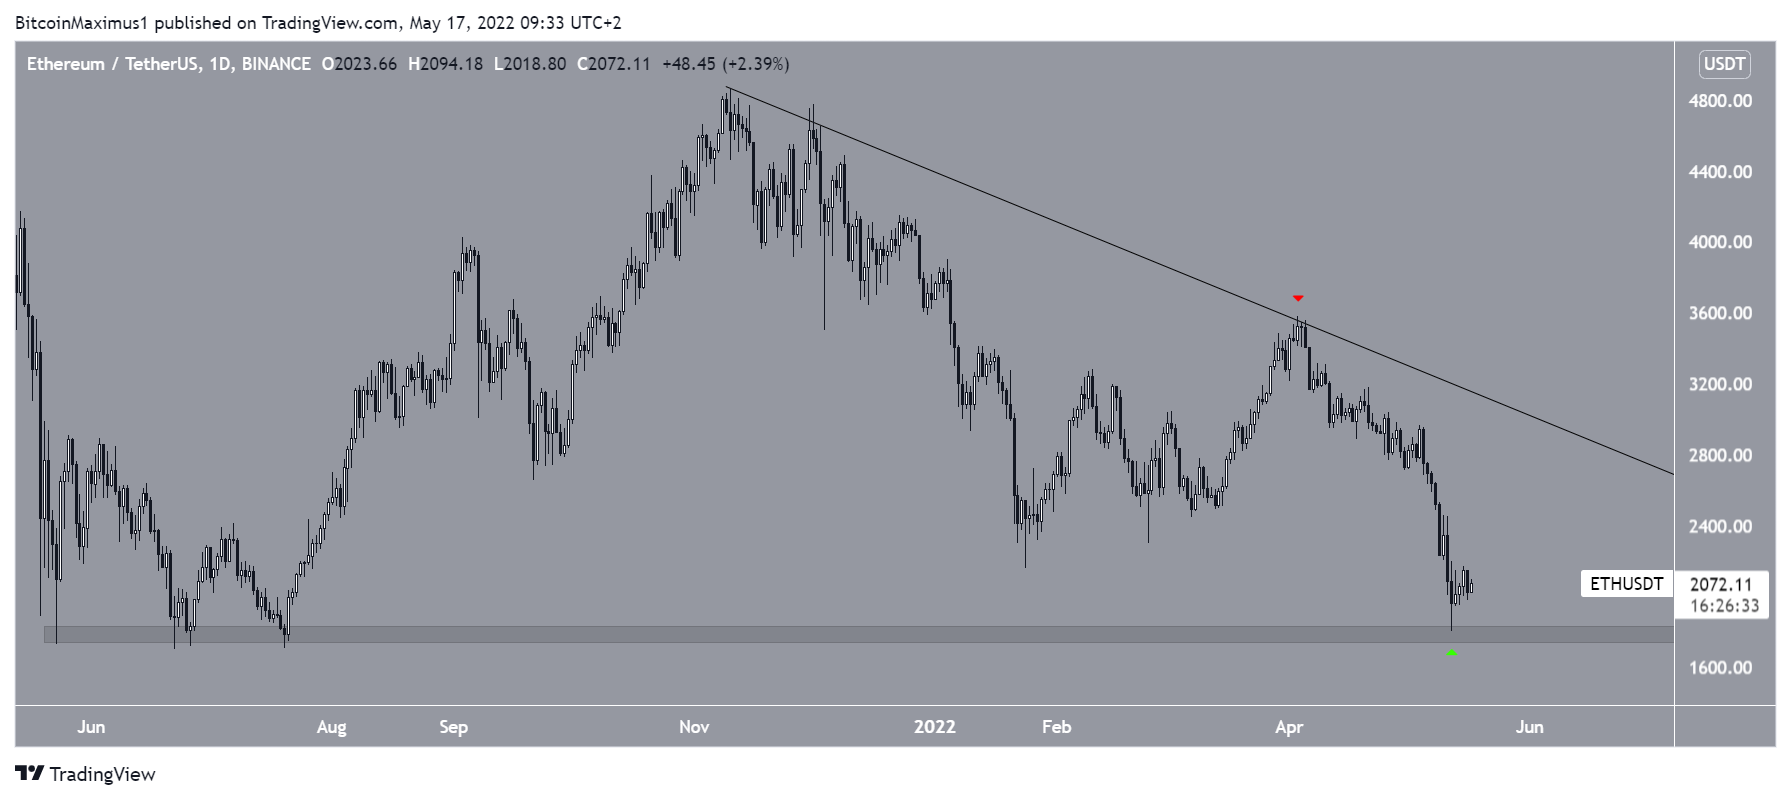
Ethereum (ETH) has been falling alongside a descending resistance line since Nov. More recently, the line caused a rejection in April (red icon).
The downward movement led to a low of $1,800 on May 12. The price bounced afterward (green icon) and created a long lower wick. The bounce made sure that the price did not break down below the May 2021 support at $2,700.
If the upward movement continues, the previously outlined support area would be at $3,000.
XRP
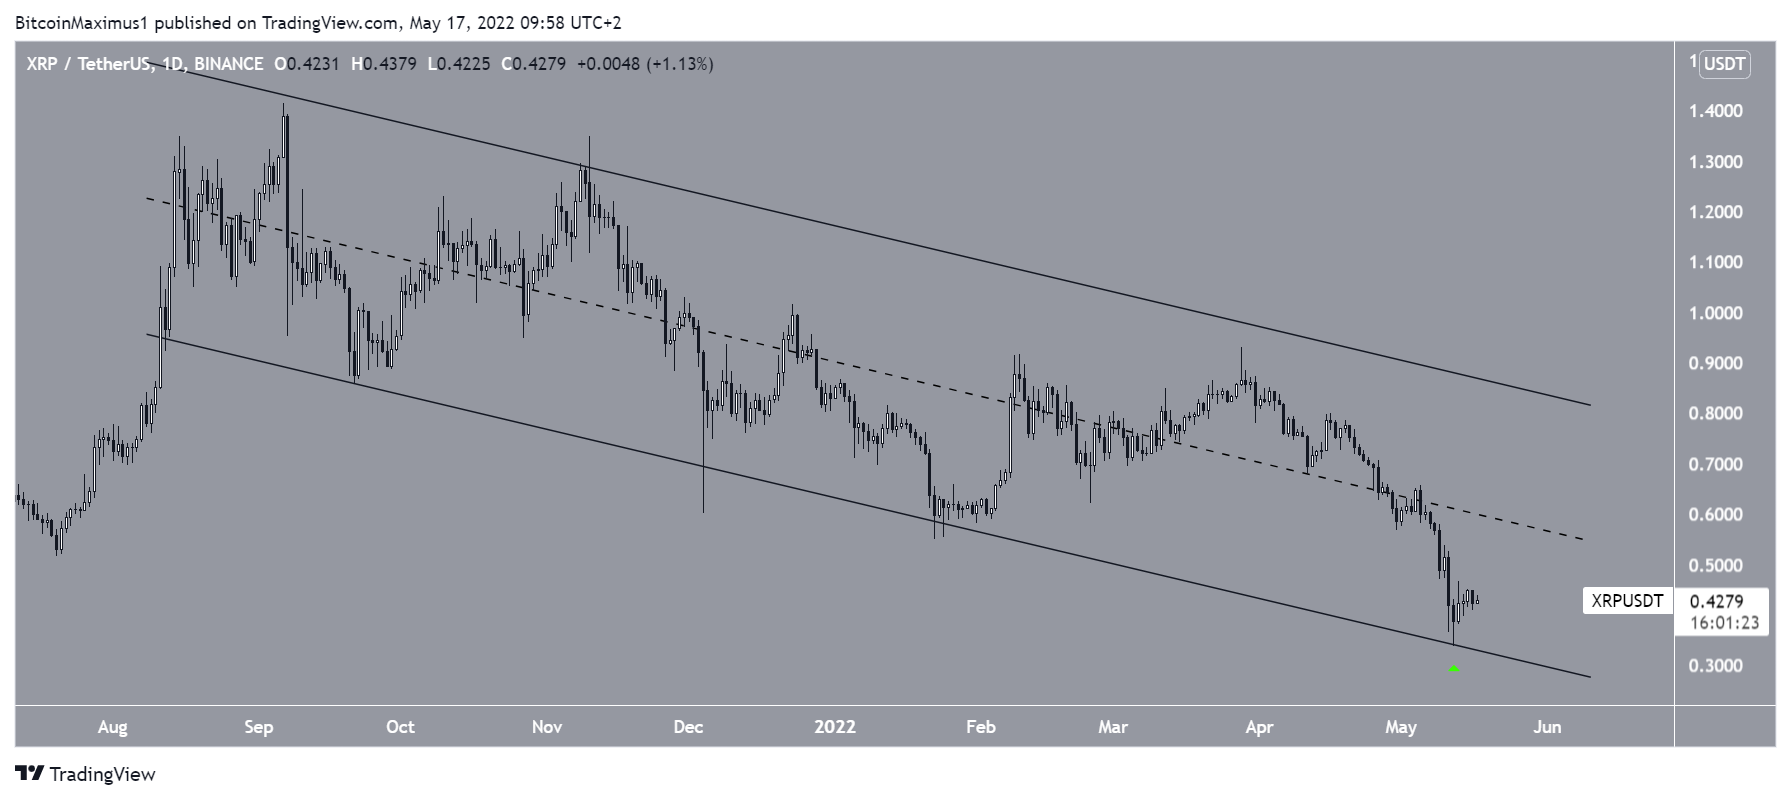
XRP has been decreasing inside a descending parallel channel since Aug 10. Both the resistance and support lines have been validated numerous times. More recently, XRP bounced at the support line of the channel on May 12 (green icon) and initiated the current upward movement.
If the increase continues, the closest resistance area would be at $0.50, created by the middle of the aforementioned channel.
KSM
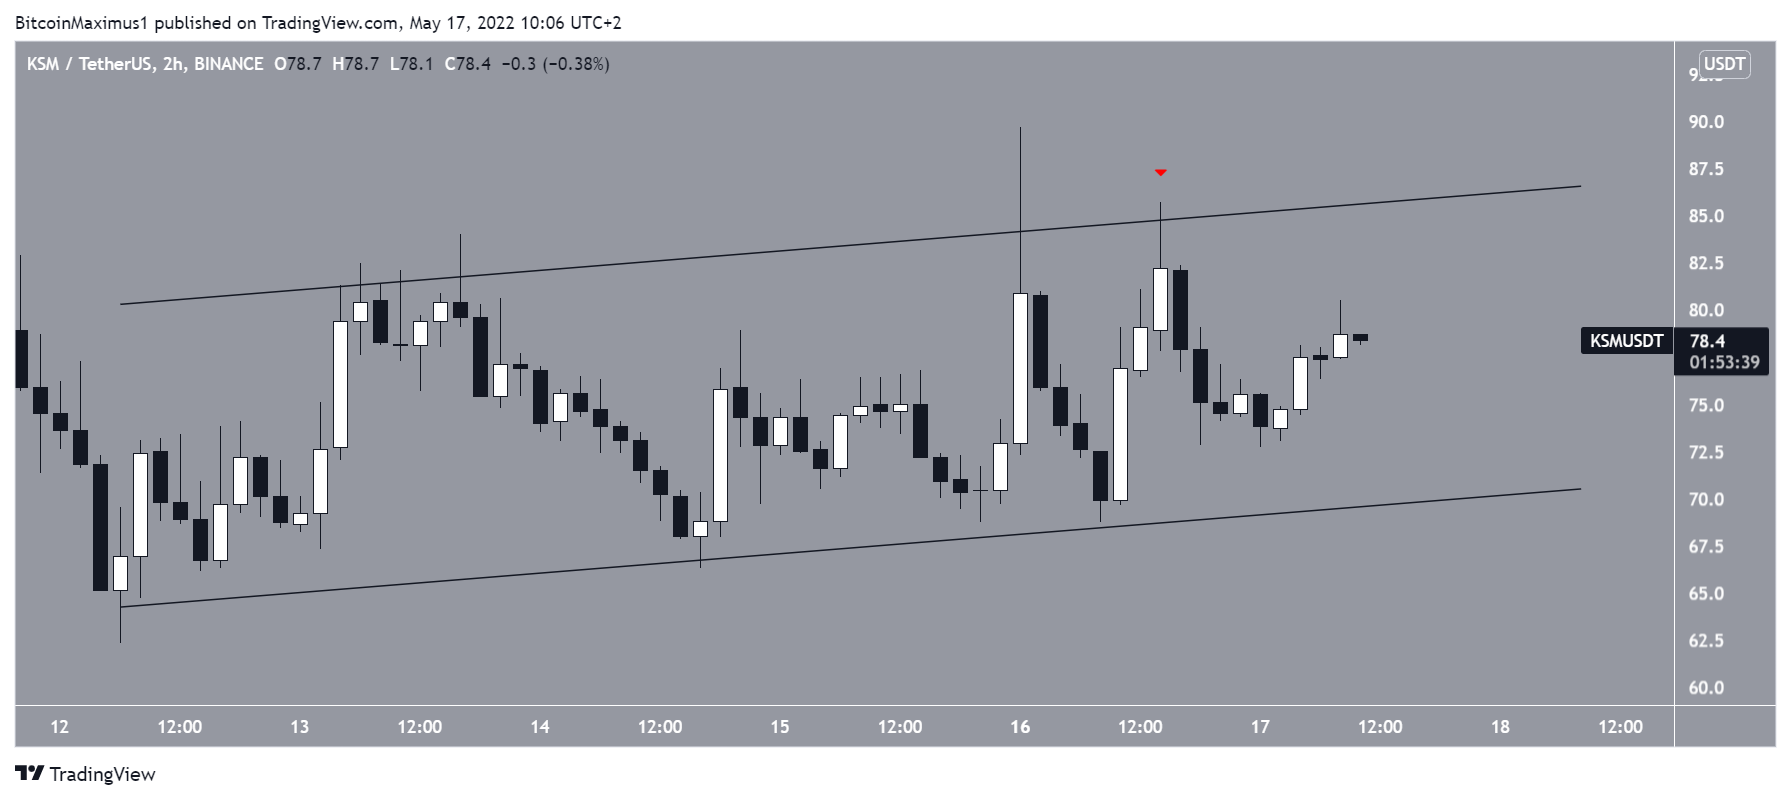
Kusama (KSM) has been trading inside an ascending parallel channel since May 12. The movement has been extremely choppy, suggesting that it could be corrective.
More recently, the price was rejected by the resistance line on May 16 (red icon). It is possible that KSM will break down from the channel and decrease toward its all-time lows.
HARD
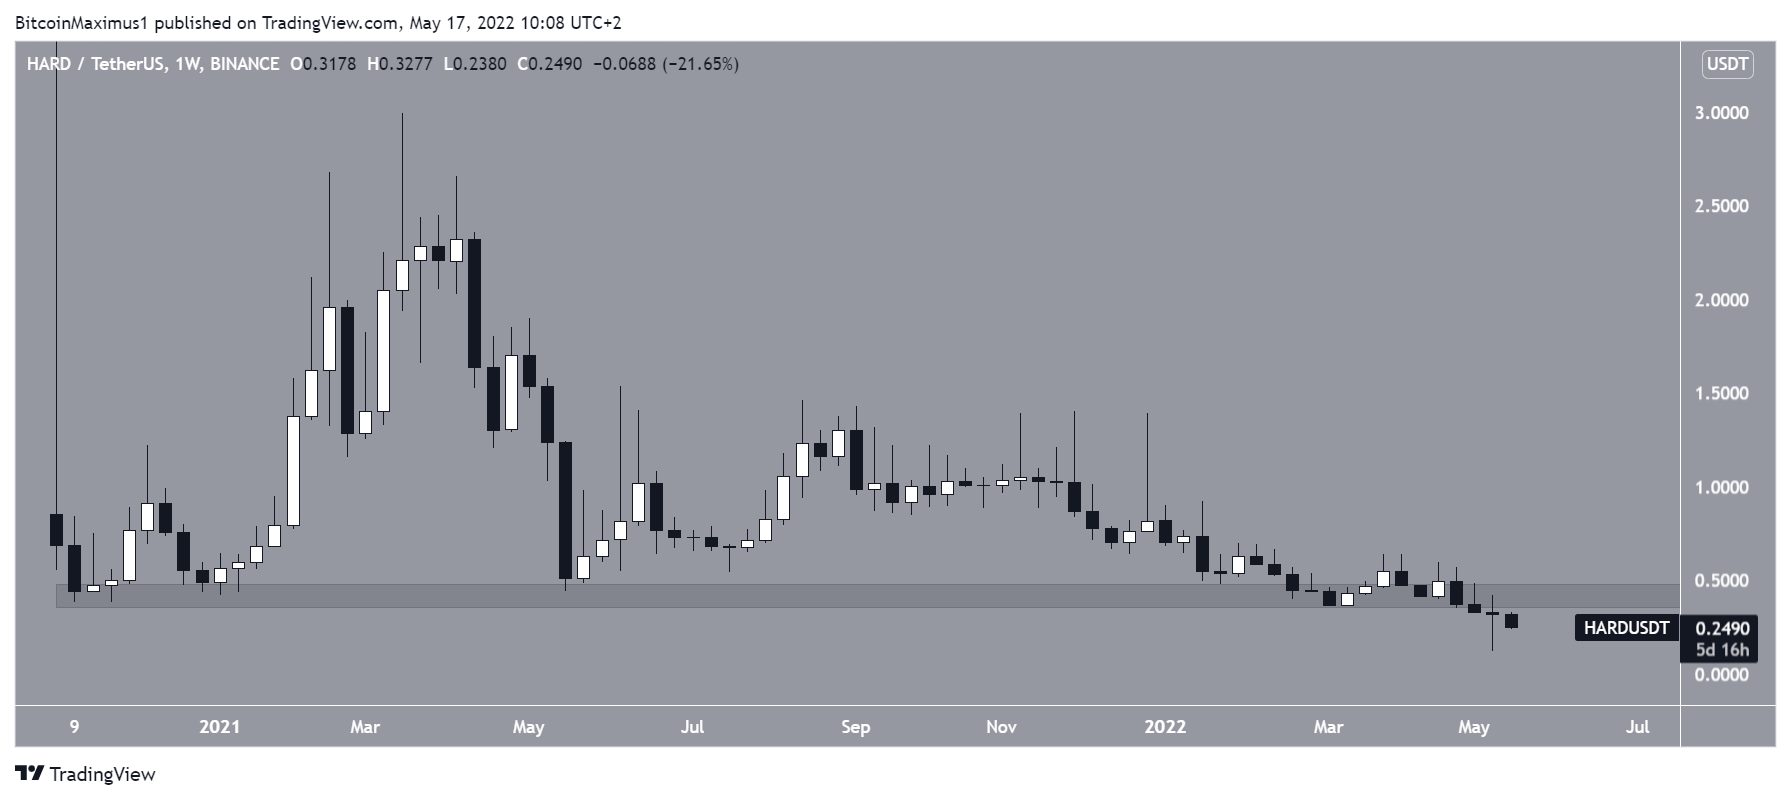
Since Nov 2020, Kava Lend (HARD) had been trading above the $0.40 horizontal support area. The price broke down at the beginning of May and proceeded to reach a low of $0.12 on May 12.
Even though HARD has bounced considerably since its May lows, increasing by more than 100% in the process, it is still trading below the $0.35 horizontal area.
SOL
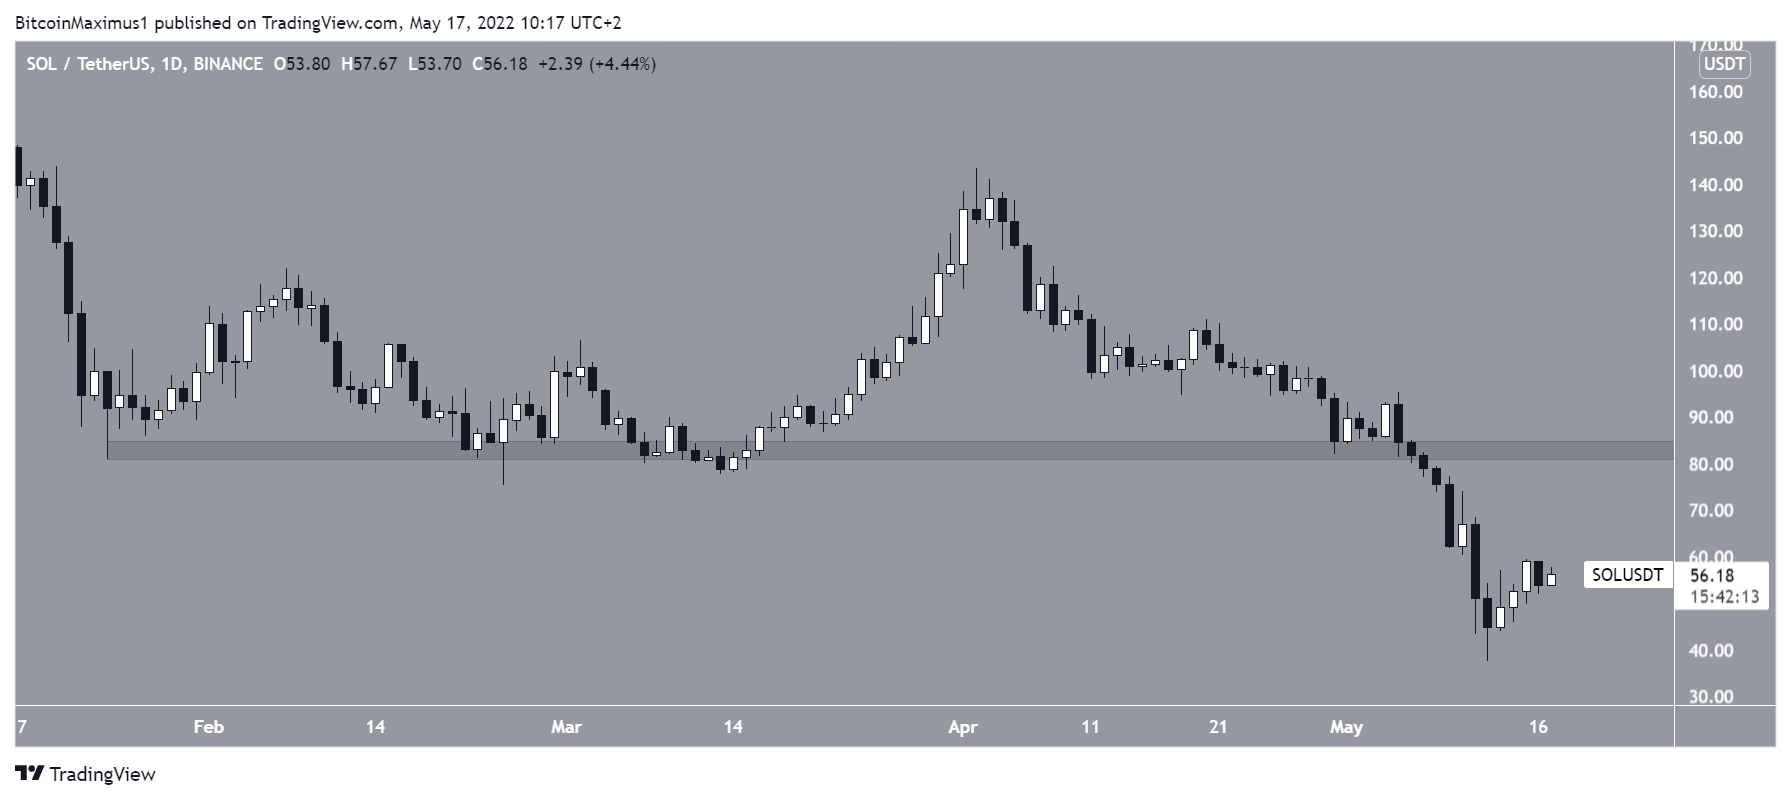
In the period between January and March, Solana (SOL) bounced at the $83 area several times. This initiated an upward movement that led to a high of $143.51 on April 2.
However, the price has been decreasing since and broke down from the $83 area on May 7, reaching a low of $37.37 on May 12.
Until SOL manages to reclaim the $83 area, the trend cannot be considered bullish.
CRO
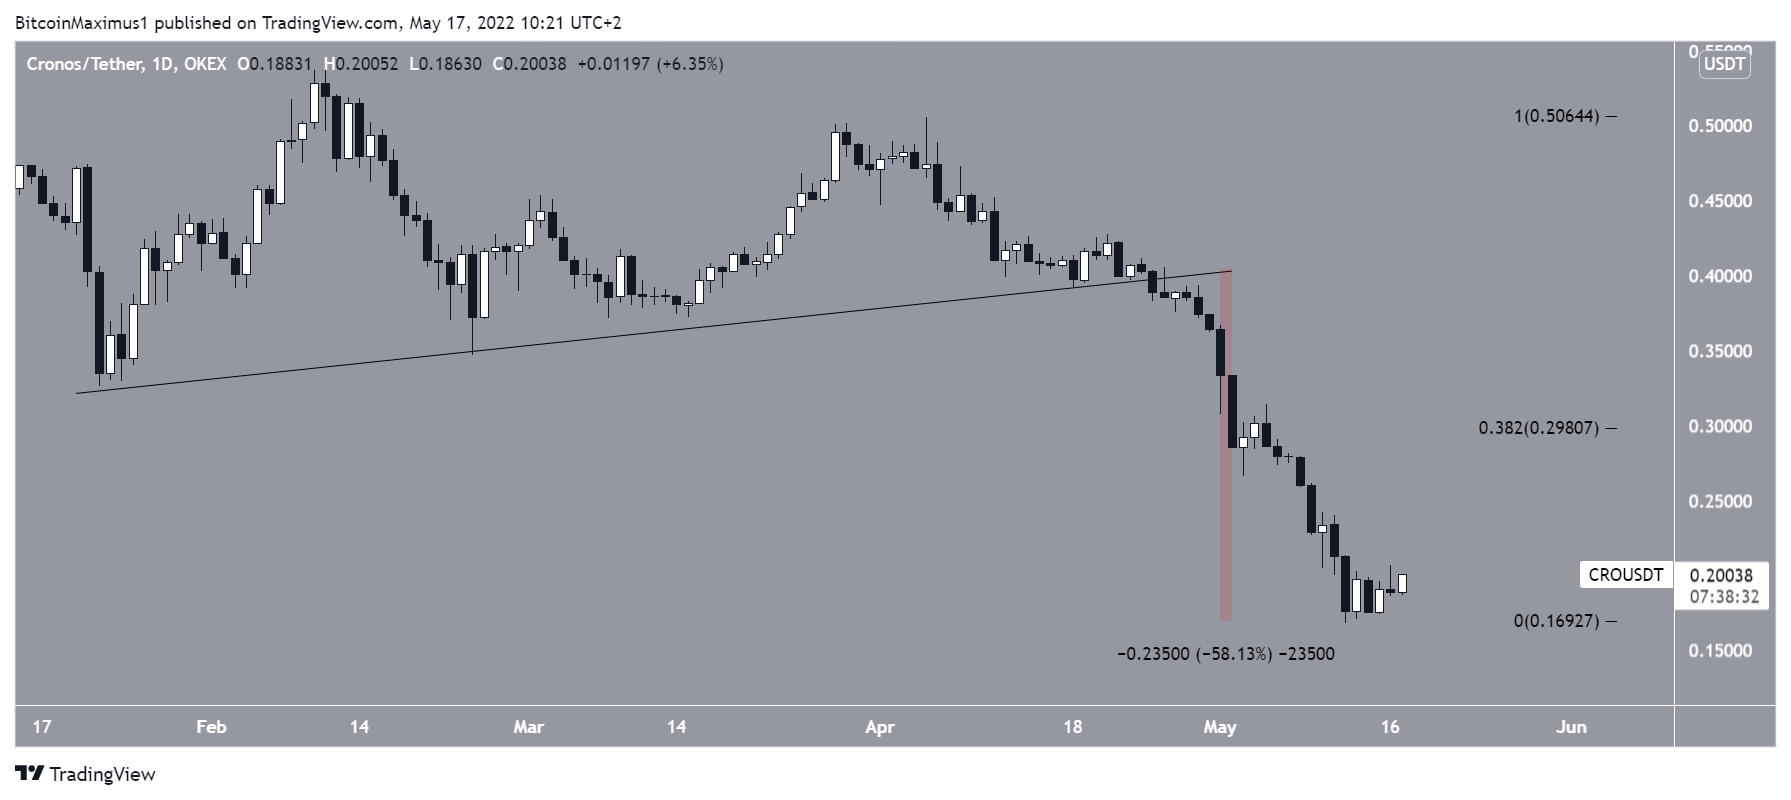
Cronos (CRO) broke down (red icon) from an ascending support line on April 25. The downward movement continued until a low of $0.167 was reached on May 12. This amounted to a decrease of 58% since the breakdown.
If the upward movement continues, the closest resistance would be at $0.30.
For Be[in]Crypto’s latest Bitcoin (BTC) analysis, click here