Since February 2021, the RUNE cryptocurrency has been moving in 500% consolidation. During this time, the RUNE price rose three times by 400%-500% and fell three times to the lower limit of consolidation. At the time of writing, the RUNE price is near the bottom line of consolidation. Of course, it is logical to assume that it is worth preparing for a new wave of growth of RUNE by 400%-500%, especially because the reversal of the RUNE cryptocurrency is always unpredictable and sharp. 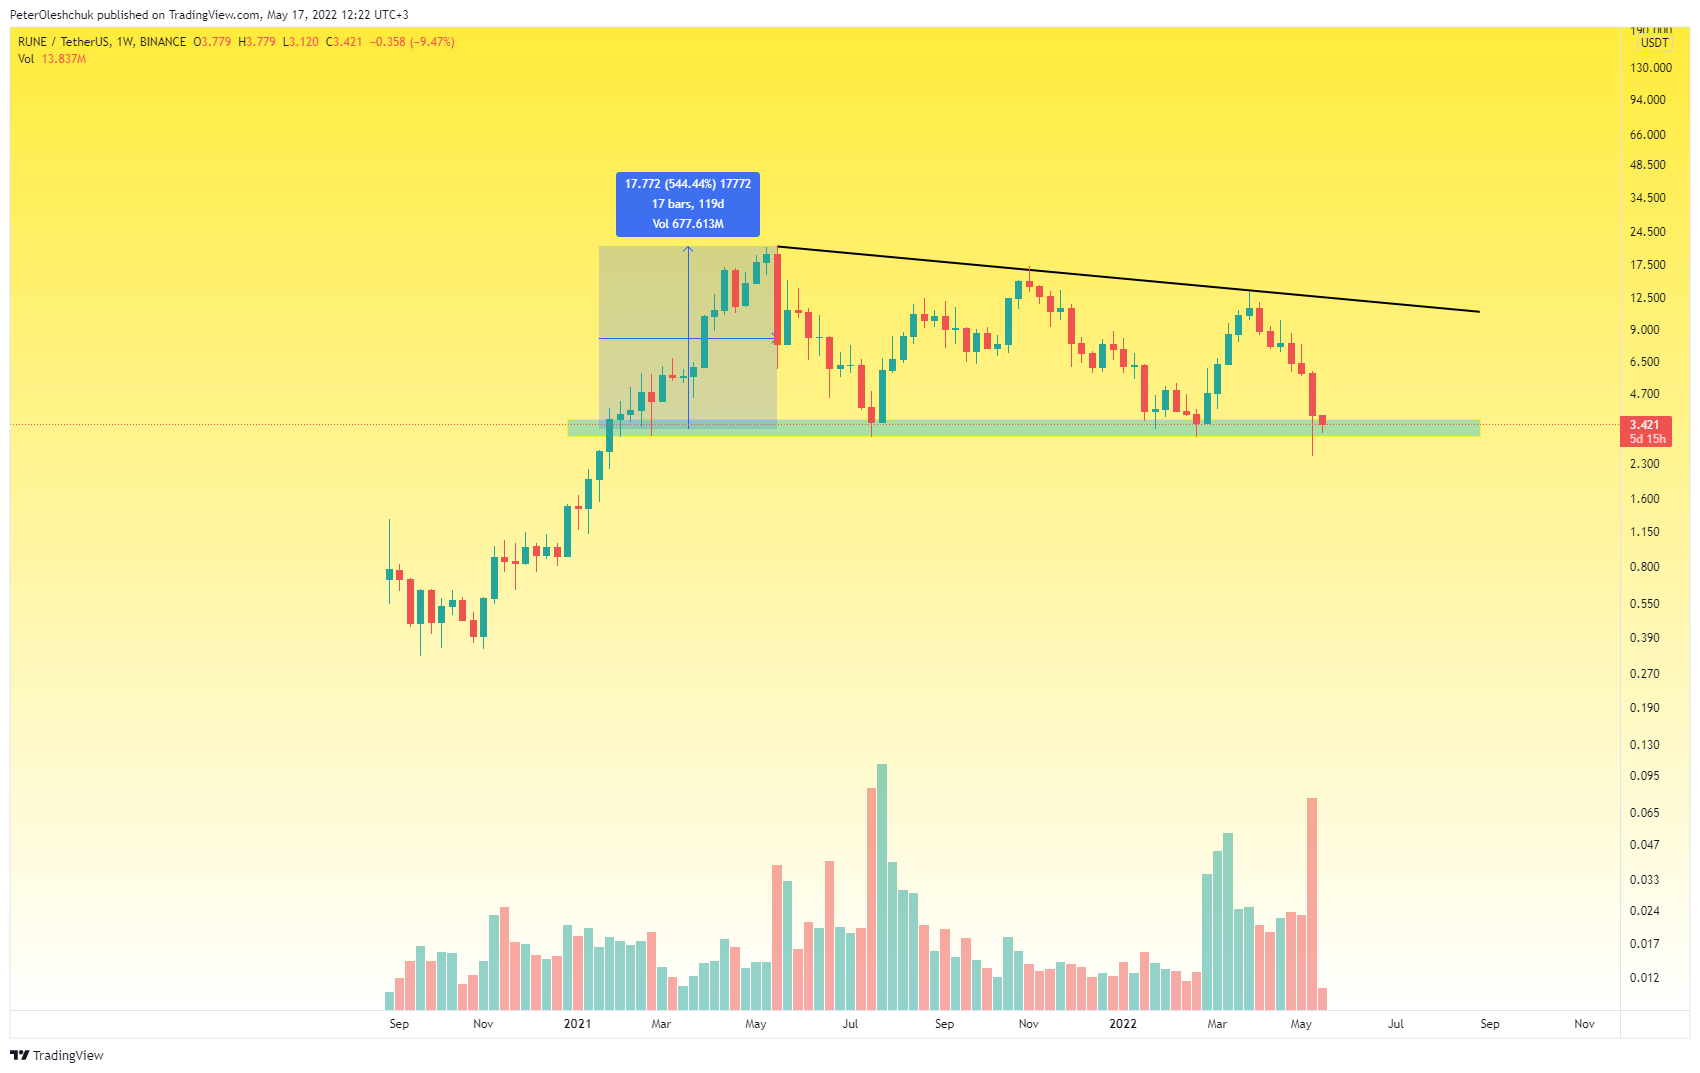 https://www.tradingview.com/x/e6ckwiE4/ However, we would like to emphasize some details that may land a little on the ground. From 17 May 2021, buyers can not update local highs, even with false breakdowns. According to local highs, you can draw a sloping trend line. But sellers manage to update local low. This speaks to the initiative of sellers, although not great at the moment. We forecast the first rebound of the RUNE price to $6.2. This mark is the local resistance of sellers and the middle of global consolidation. If the cryptocurrency market globally plans to fall further, it is from the $6.2 mark that a new fall wave may begin, which will destroy the consolidation structure.
Technical Analysis Of RUNE On The Daily Timeframe
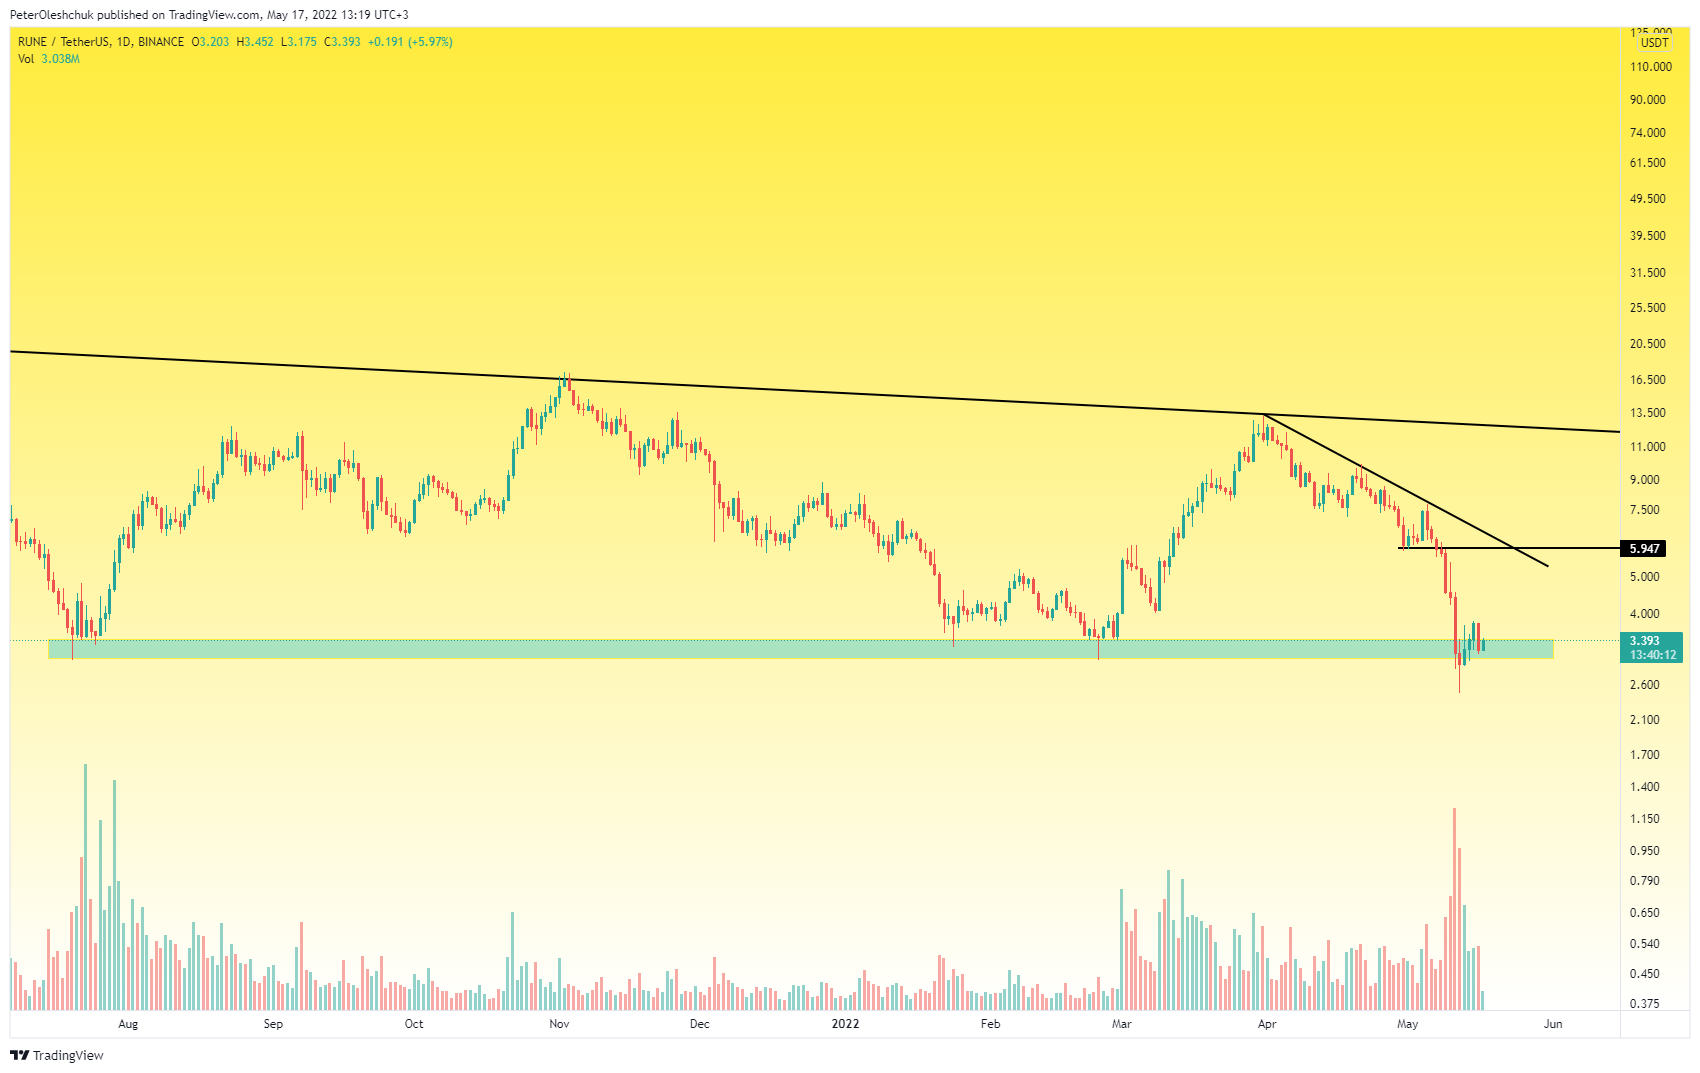 https://www.tradingview.com/x/hID2a6hY/ Analyzing the movement of the RUNE price on the daily timeframe, we see that trading volumes near the lower limit of consolidation are high. Buyers retained the liquidity zone, allowing sellers to break the $3 mark only once. At the time of writing, the bottom is compacted. In fact, the rebound of the RUNE price has not yet begun and now buyers are gaining ground for it. If during the trading week on 16 May buyers do not allow the price to fall and fix below $3, we will expect the local growth trend to continue until the end of May. The first local stop for buyers can take place at $4.45. After testing this mark, the RUNE price may go for a short correction, which will increase the long position on RUNE with low risks. The final target on the daily timeframe coincides with the target on the weekly one. This is the $6 mark. At this point is the trend line of sellers and it is unclear whether buyers will have enough strength to take control of it.
The RUNEBTC Price Has Come To A Potential Purchase Zone
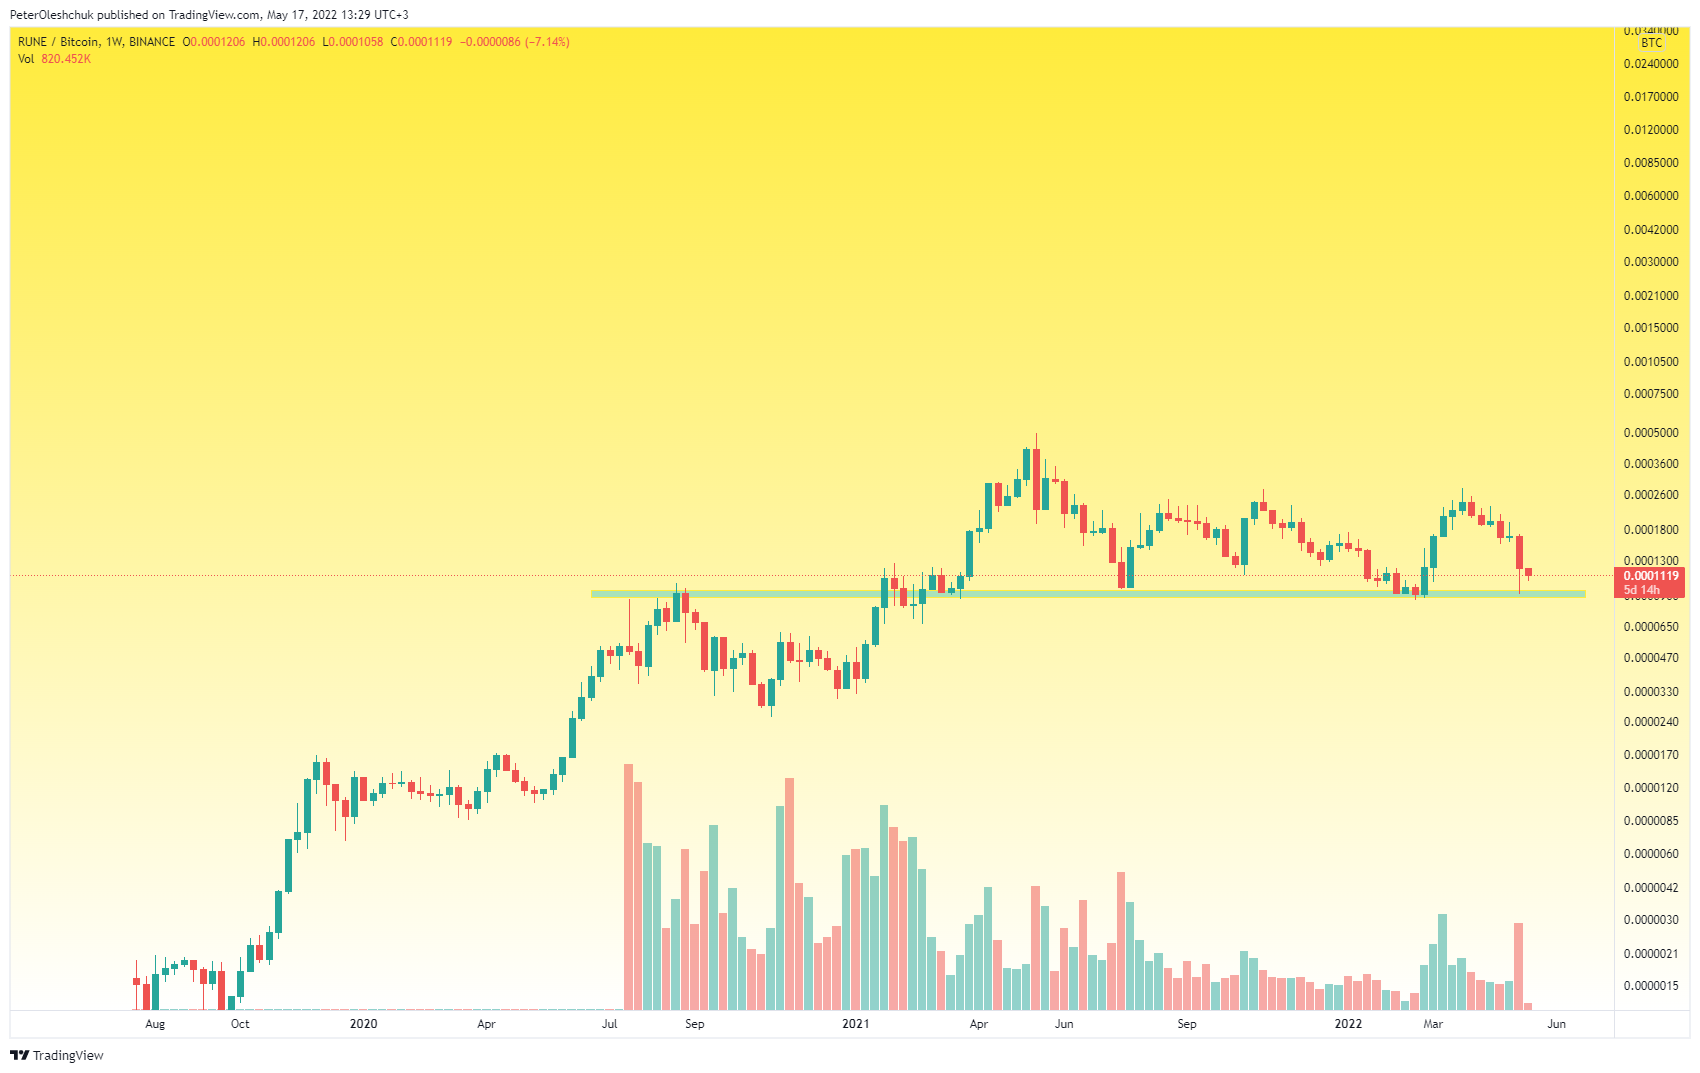 https://www.tradingview.com/x/tlm89cSs/ An interesting difference can be seen when comparing the weekly charts of the pairs RUNEBTC and RUNEUSDT. If on the RUNEUSDT chart buyers could not update the local highs in the consolidations, on the RUNEBTC chart the opposite is true. This indicates a bad effect of Bitcoin on RUNE. Therefore, the main chart for decision-making is RUNEBTC. So far, we see that the lower limit of consolidation has been maintained and trading volumes have increased. Therefore, it is advisable to take risks and continue trading within the consolidation.