Fantom is a blockchain platform that allows users to create decentralized apps, digital assets, and enterprise applications. It uses a consensus protocol that facilitates instant transactions, high scalability, security, and reliability. FTM is the prime governance token of this ecosystem. The following technical analysis will predict the price trends for the next two days:
Past Performance
On May 10, 2021, FTM started trading at $0.92. On May 16, 2021, FTM closed at $0.63. Thus, in the past week, the price has decreased by approximately 31%. In the past 24 hours, FTM has traded between $0.57-$0.63.
https://s3.tradingview.com/snapshots/r/rbCJtV78.png
Day-Ahead and Tomorrow
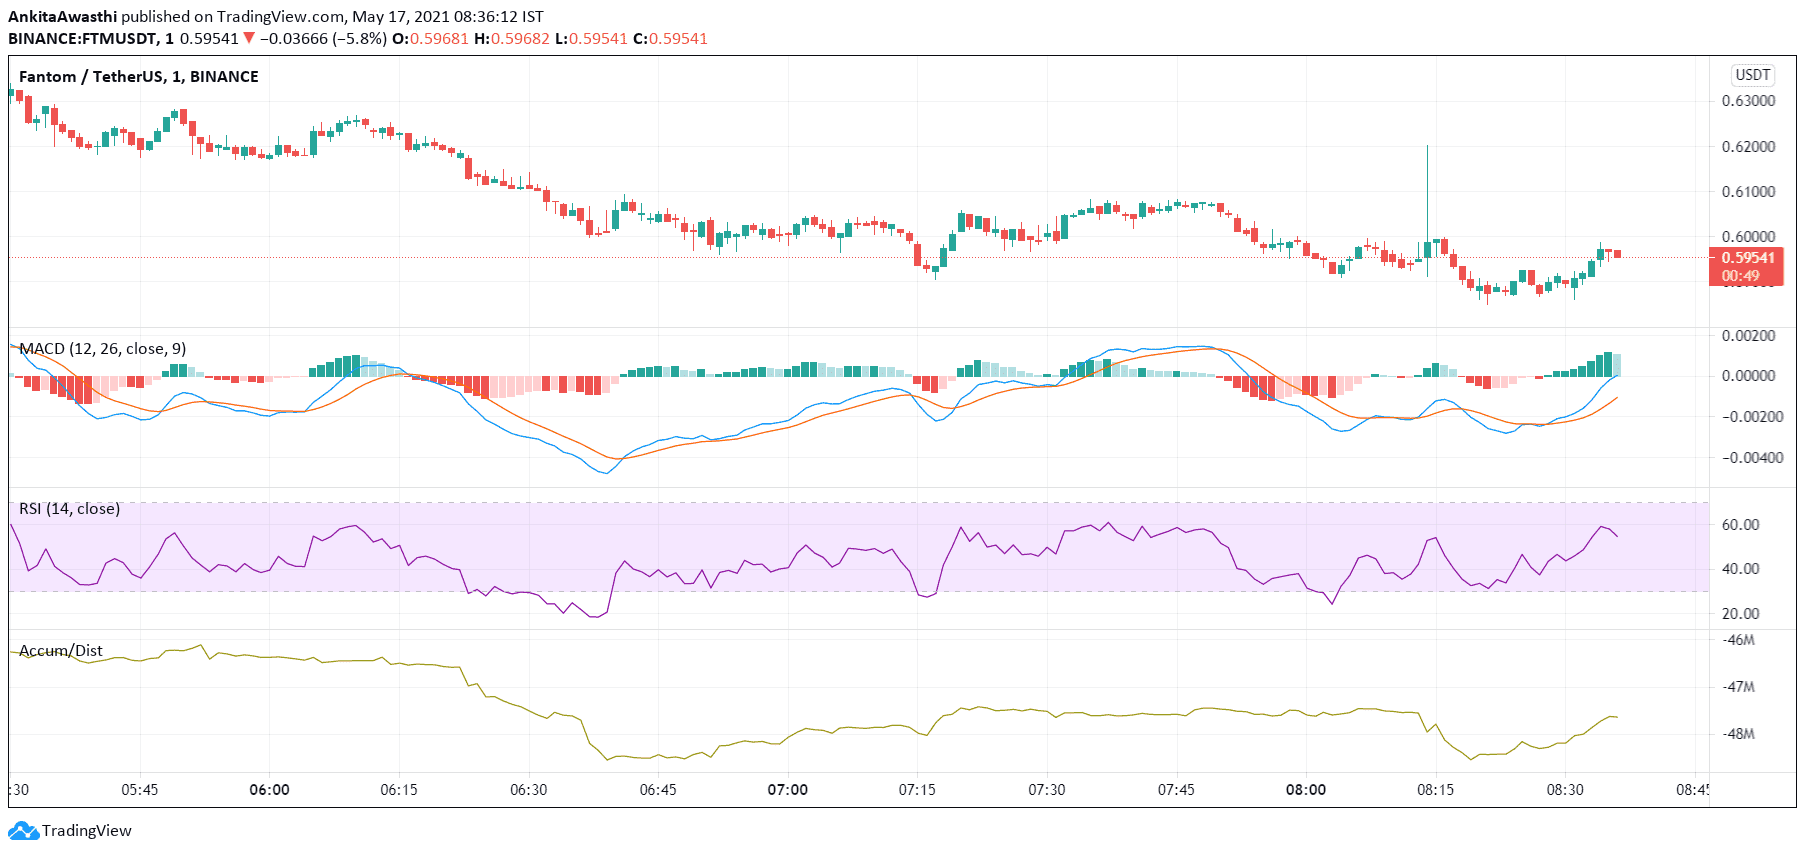
Currently, FTM is trading at $0.59. The price has decreased from the day’s opening price of $0.63. Thus, the market seems to be bearish.
The MACD line has turned positive, and soon the signal line will become positive too. Moreover, a bullish crossover by the MACD line over the signal line has occurred. Thus, the market momentum is likely to become bullish soon.
Currently, the RSI indicator is at 40%. It faced rejection at 60%. This implies that selling pressures are stronger than buying pressures. Hence, the price is likely to go down further.
The A/D indicator had fallen steeply but for the past 30 minutes, it has been rising steadily. This implies that whale accumulations are gradually surpassing whale distributions. Thus, the A/D indicator is giving further credence to the bearish trend reversal indicated by the MACD oscillator.
In a nutshell, when we look at all three oscillators together, we can say that the price may continue to fall for some time. We have to wait and watch to see when the price starts rising and whether this price rise is temporary or a trend reversal.
FTM Technical Analysis
Currently, the price is below the second Fibonacci pivot support level of $0.59. It may soon fall below the third support level of $0.56. Thereafter, we have to wait and watch to see if the price starts rising.
At present, the price has tested and fallen below the 23.6% FIB retracement level of $0.59. The price is likely to fall below the 23.6% FIB extension level of $0.57 soon. As of now, the bears are strong, and we have to wait and watch if bulls gain strength till day end. If not, then the price downswing is likely to continue tomorrow as well.