Avalanche price analysis has shown a bearish trend recently. The market has been in consolidation for some time now after a strong rally towards $40. There is a descending triangle pattern that is being formed on the 4-hour chart. This pattern will be complete when the price breaks below the lower trendline. The breakout level is around $23.55 and if the price breaks below this level, it can further decline to $16.80. On the other hand, if the price breaks above the upper trendline of the descending triangle pattern, it can move towards $70.
Avalanche (AVAX) has been one of the best-performing altcoins in the market over the past few weeks. The coin surged from $5 to $40 in a matter of weeks and is currently consolidating below this level. The 4-hour chart shows that the price has formed a descending triangle pattern, which is a bearish reversal pattern.
The triangle pattern will be complete when the price breaks below the lower trendline, which is around $23.55. If the price breaks below this level, it can further decline to $16.80. On the other hand, if the price breaks above the upper trendline of the descending triangle pattern, it can move towards $40.
The RSI is currently near the 50 level and is showing no signs of a breakout in either direction. The MACD is also close to the center line and is not giving any clear trading signals.
AVAX/USD 1-day price analysis: Bears increase their steps as the market momentum favors them
Avalanche price analysis shows that the market is currently in a consolidation phase and it is difficult to predict which way the price will break out. Traders should wait for a clear breakout before entering any positions.
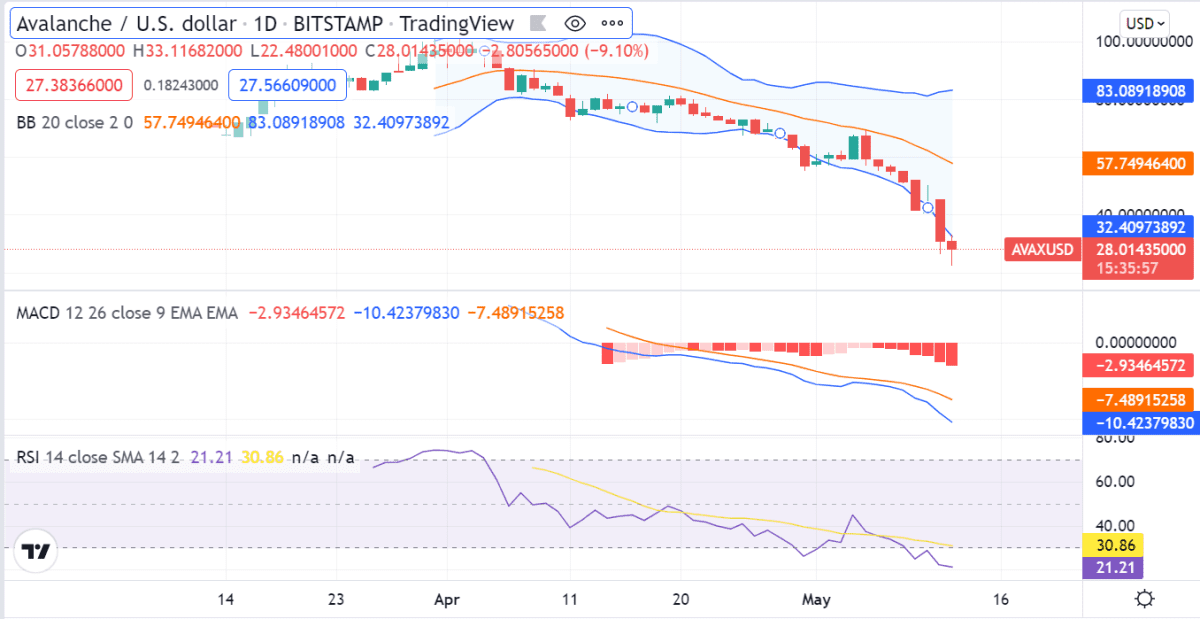 AVAX/USD 1-day price chart, source: TradingView
The 1-day Avalanche price analysis chart shows that the market has been in a consolidation phase for the past few days. The price is currently trading between the $23.55 and $40 levels. The RSI is close to the 50 level, which indicates that the market is currently neutral. The MACD is also close to the center line and is not giving any clear trading signals.
Avalanche price analysis on a 4-hour price chart: AVAX tests the $28 level
The 4-hour Avalanche price chart shows that the market has been in a consolidation phase for the past few days. The price is currently trading between the $23.55 and $40 levels. The RSI is close to the 50 level, which indicates that the market is currently neutral. The MACD is also close to the center line and is not giving any clear trading signals.

AVAX/USD 4-hour price chart, source: TradingView
The market Avalanche price analysis on the 4-hour time frame shows that the market is currently in a consolidation phase. The market has been trading between the $23.55 and $40 levels for the past few days. The RSI is close to the 50 level, which indicates that the market is currently neutral.
Avalanche price analysis conclusion
The market is bearish and is likely to break below the $23.55 level soon. If the price breaks below this level, it can further decline to $16.80. On the other hand, if the price breaks above the upper trendline of the descending triangle pattern, it can move towards $40.
Disclaimer. The information provided is not trading advice. Cryptopolitan.com holds no liability for any investments made based on the information provided on this page. We strongly recommend independent research and/or consultation with a qualified professional before making any investment decisions.