Be[in]Crypto takes a look at the price movement for seven different cryptocurrencies, including XRP (XRP), which has broken down from a long-term horizontal support level.
BTC
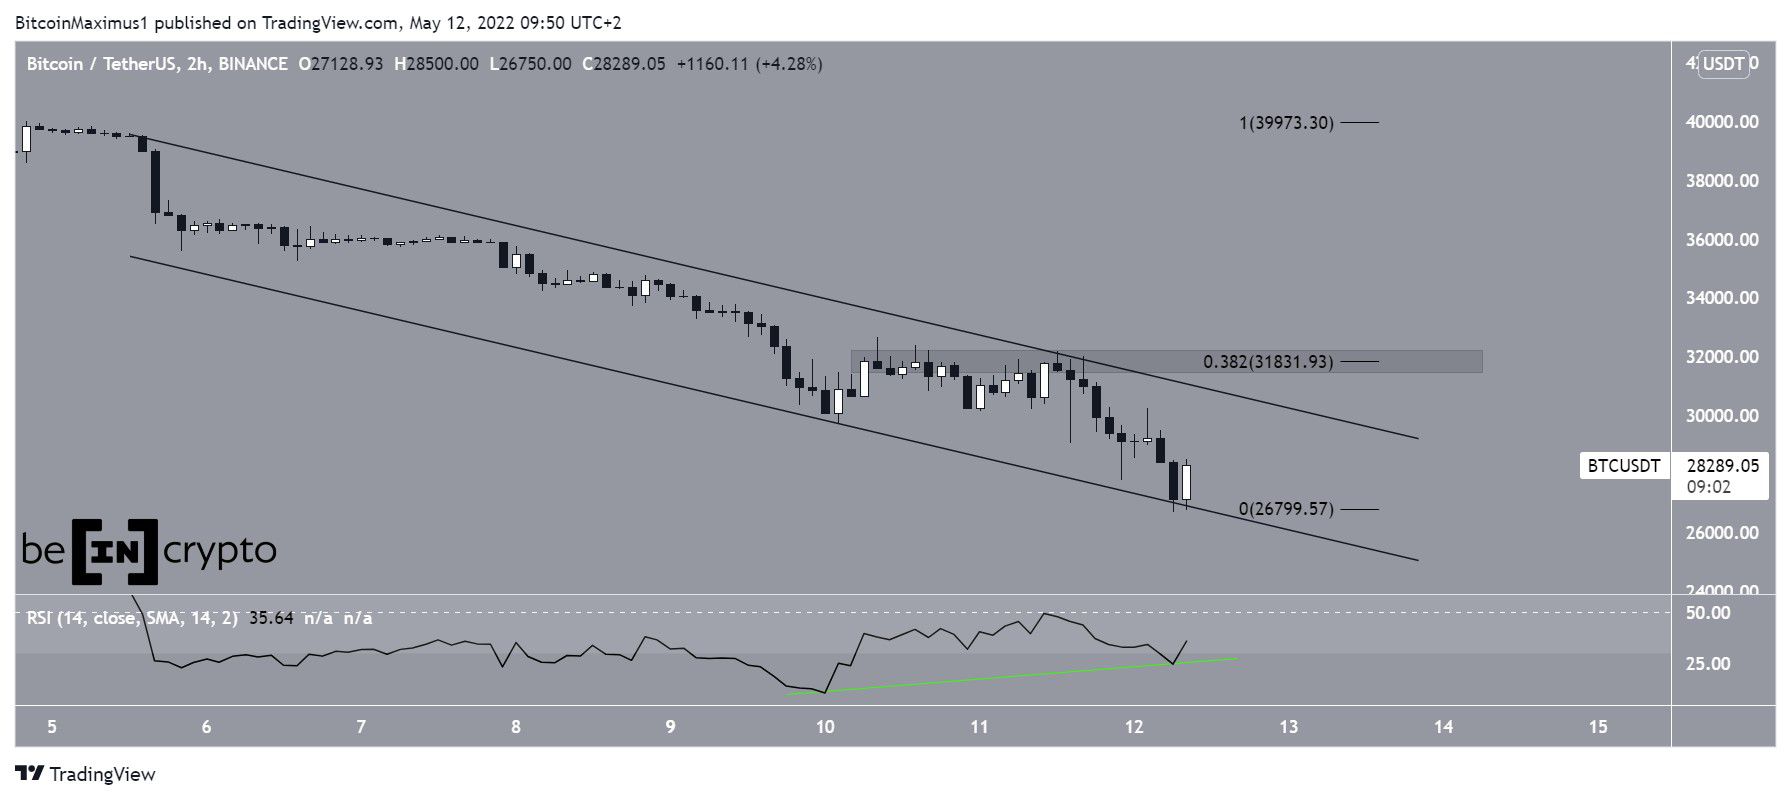
Bitcoin (BTC) has been decreasing inside a descending parallel channel since May 5. This downward movement has so far led to a low of $26,700 on May 12. The low served to validate the support line of the descending parallel channel. Additionally, it was combined with bullish divergence in the RSI.
If a breakout from the channel were to occur, there would be heavy resistance at $31,800. This is the 0.382 Fib retracement resistance level and a horizontal resistance area.
ETH
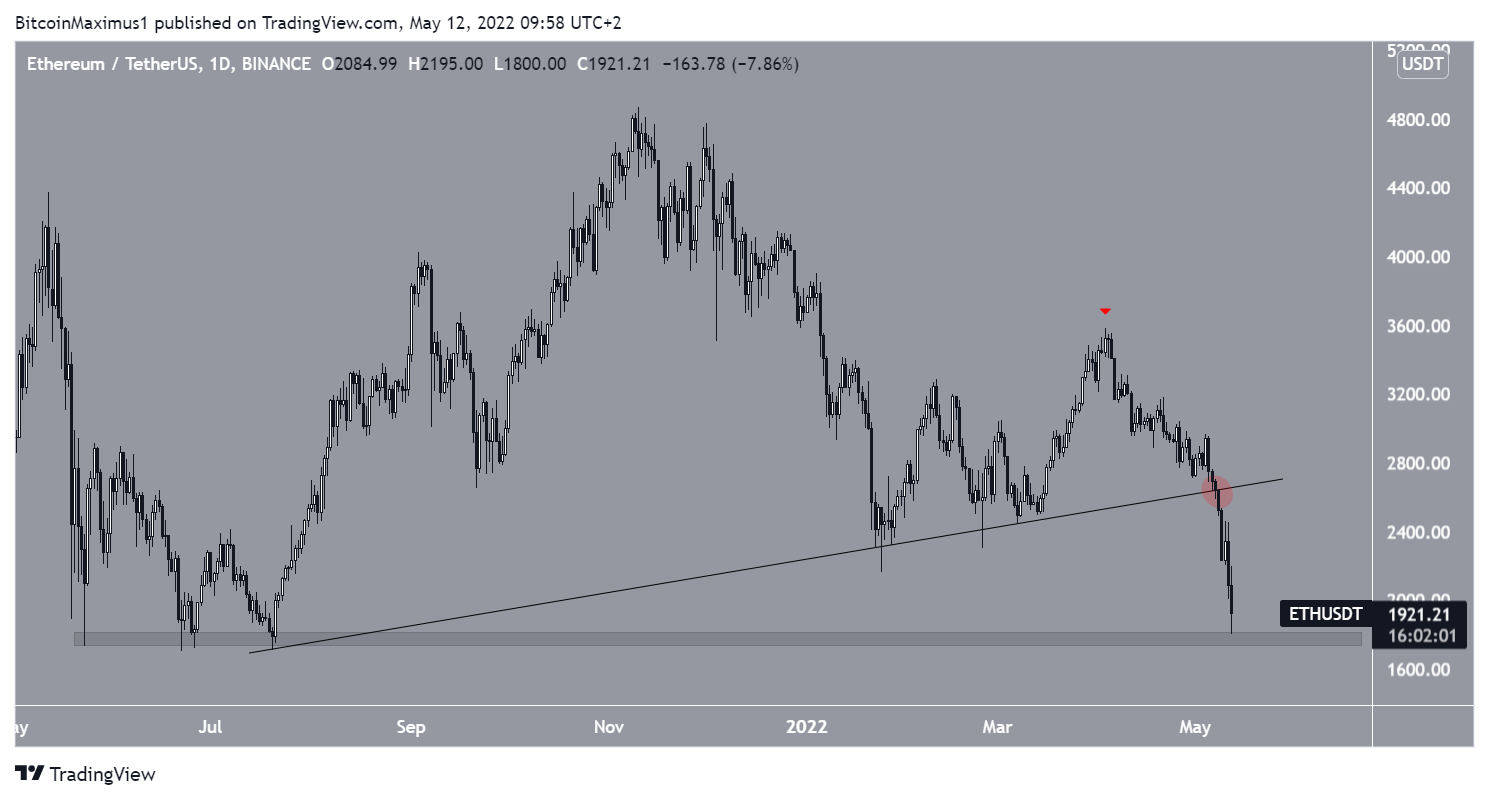
ETH has been falling at an accelerated rate since April 3 (red icon). On May 8, it broke down from an ascending support line, which had previously been in place since July 2021.
So far, ETH has reached a low of $1,800, doing so on May 12. The low was made very close to the $2,700 horizontal support area, which had previously been in place since June 2021.
XRP
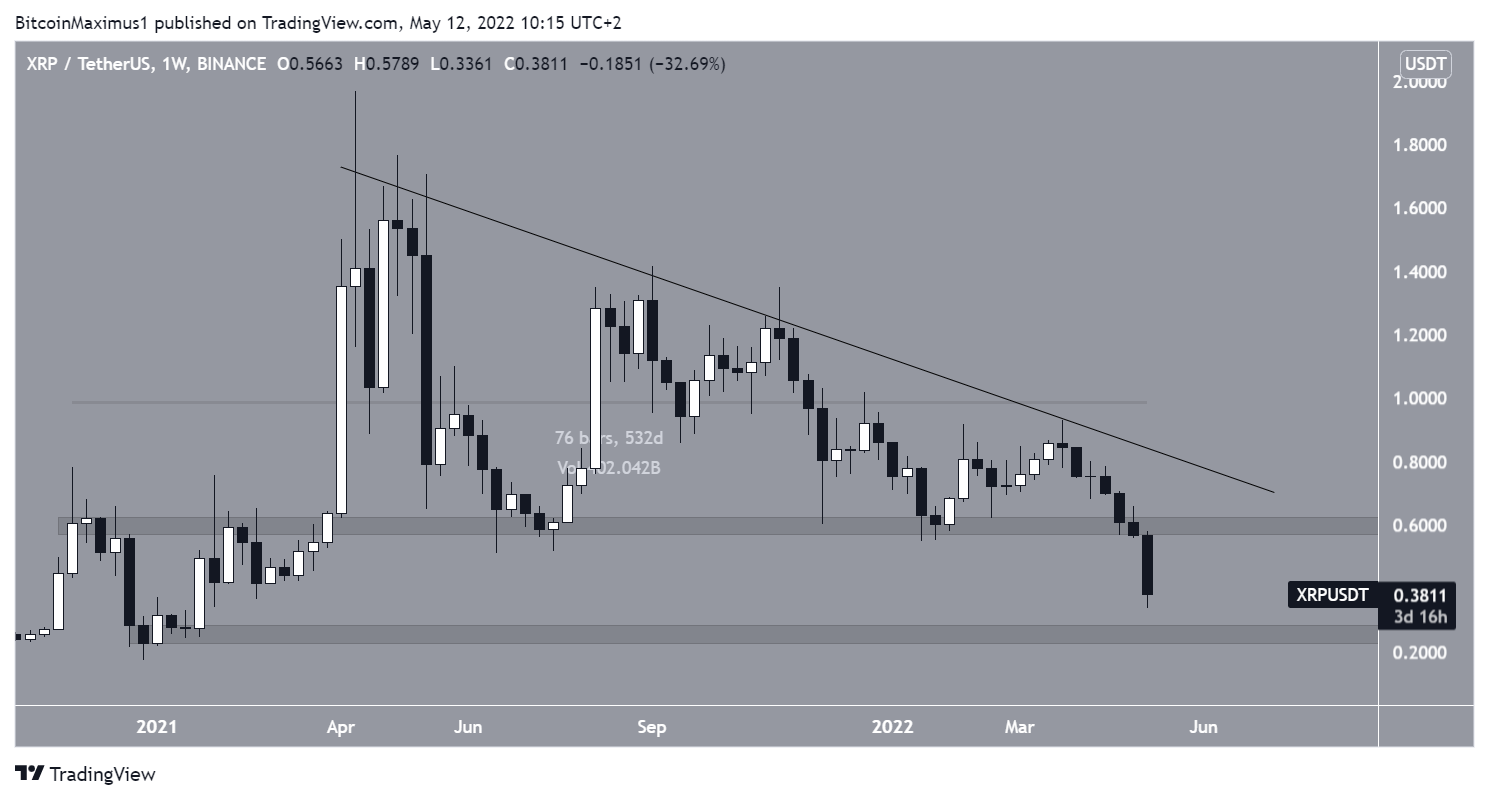
XRP has been falling underneath a descending resistance line since April 2021. The line has been tested numerous times, most recently in March (red icon).
The price has been falling at an accelerated rate since, breaking down from the $0.60 area in the process. This is a crucial level that had previously acted as either resistance or support for the past 530 days. As a result, the breakdown from it is a major bearish development.
The next closest support area is at $0.25. This is a horizontal level that was last reached in Dec 2020.
WAVES
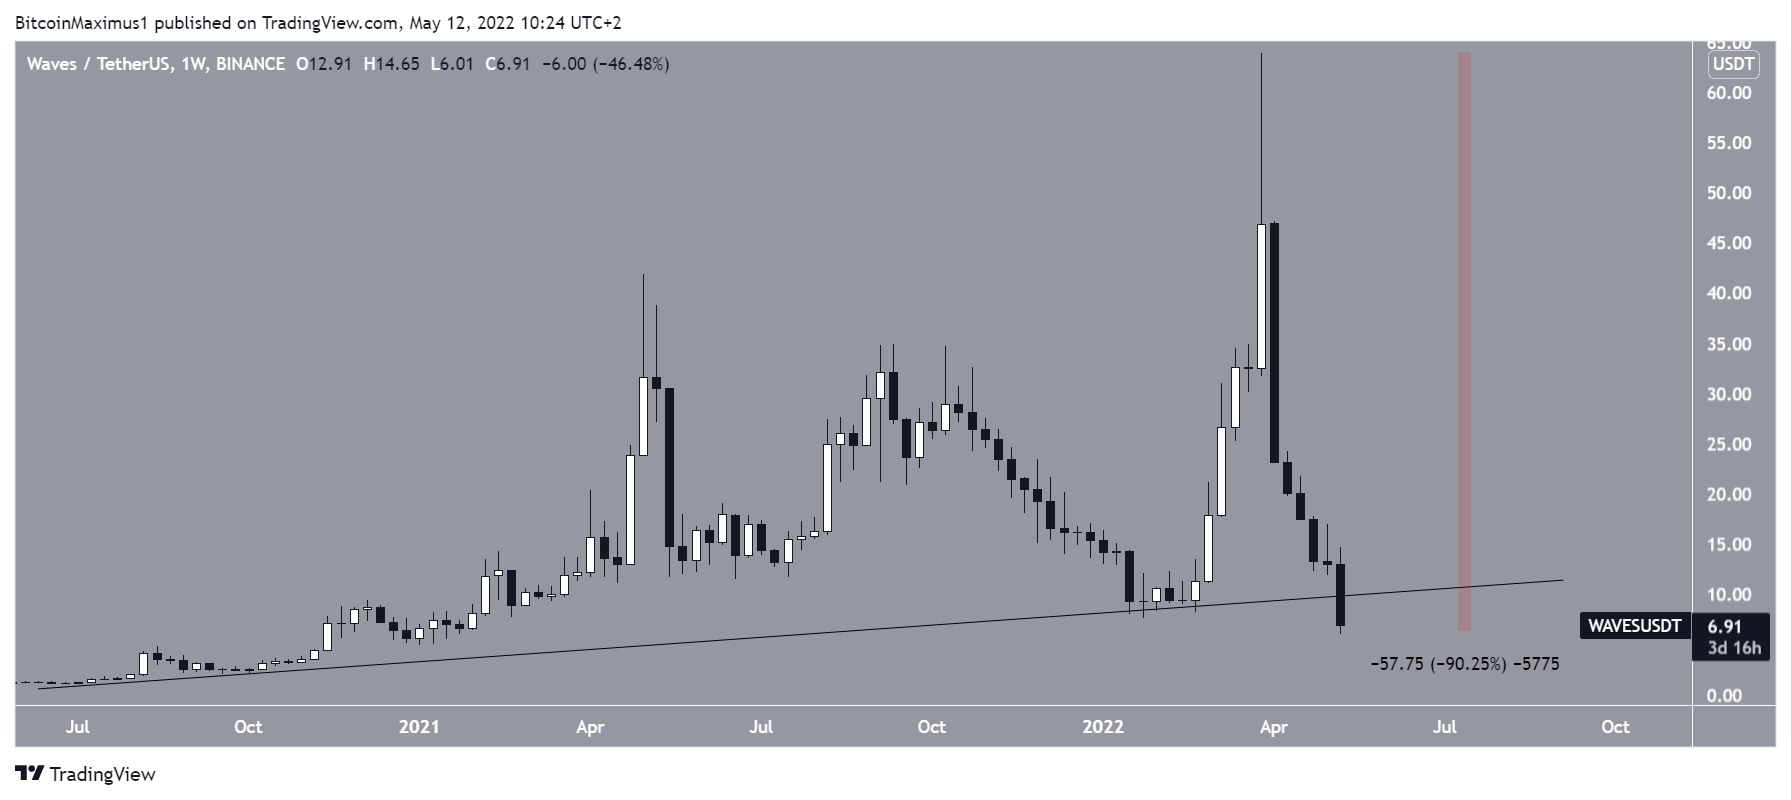
Waves (WAVES) has been decreasing at an accelerated rate since reaching an all-time high price of $63.88 in March. The downward movement has been swift, and so far the price has decreased by a full 90%.
Currently, WAVES is in the process of breaking down from an ascending support line that had previously been in place since July 2021.
APE
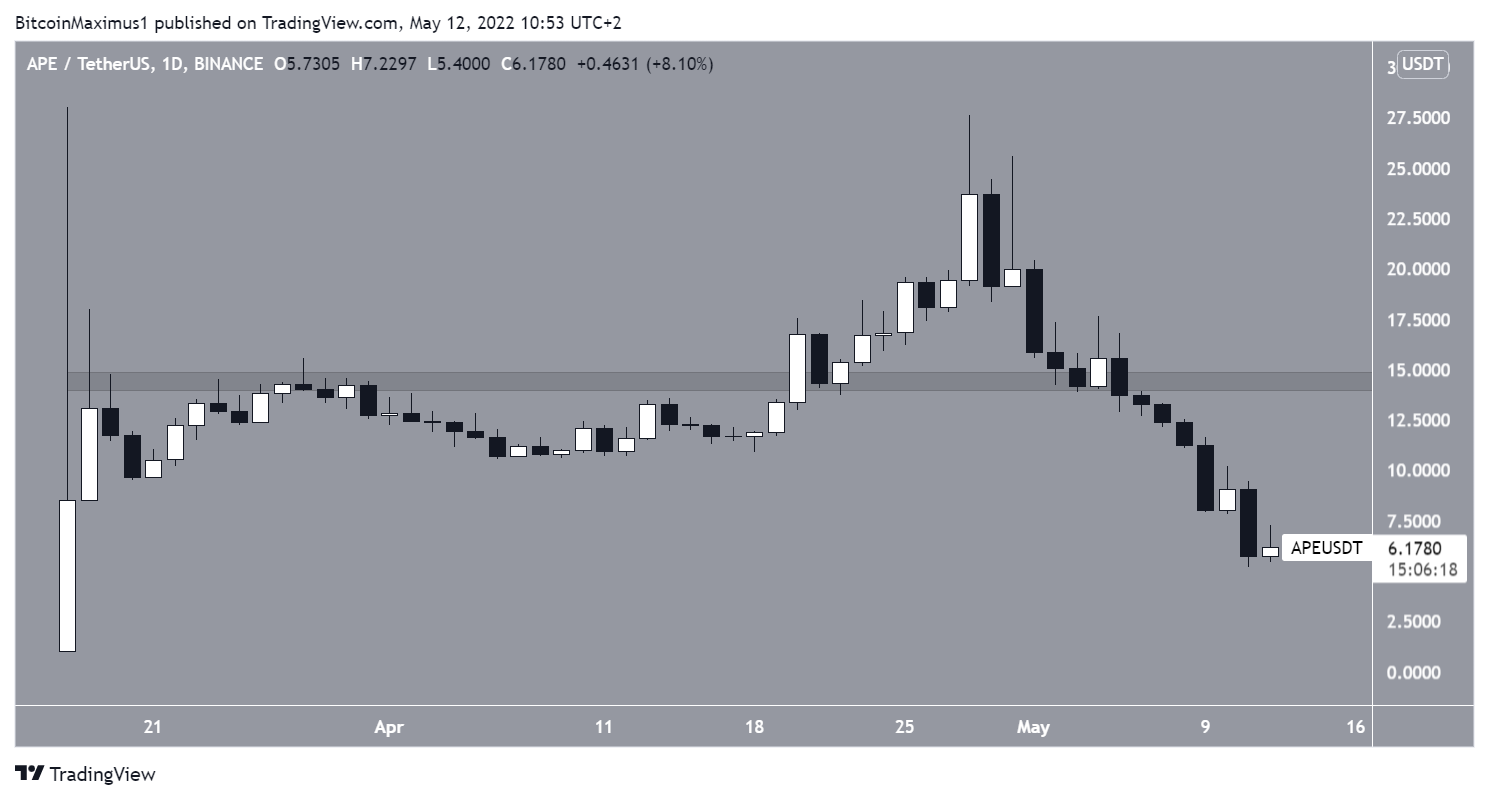
ApeCoin (APE) has been falling since reaching a high of $27.60 on April 28. The downward movement has been swift, and on May 5, the price broke down from the $14 horizontal support.
So far, it has reached a low of $5.17 on May 11.
There are no more horizontal support levels left until an all-time low.
1INCH
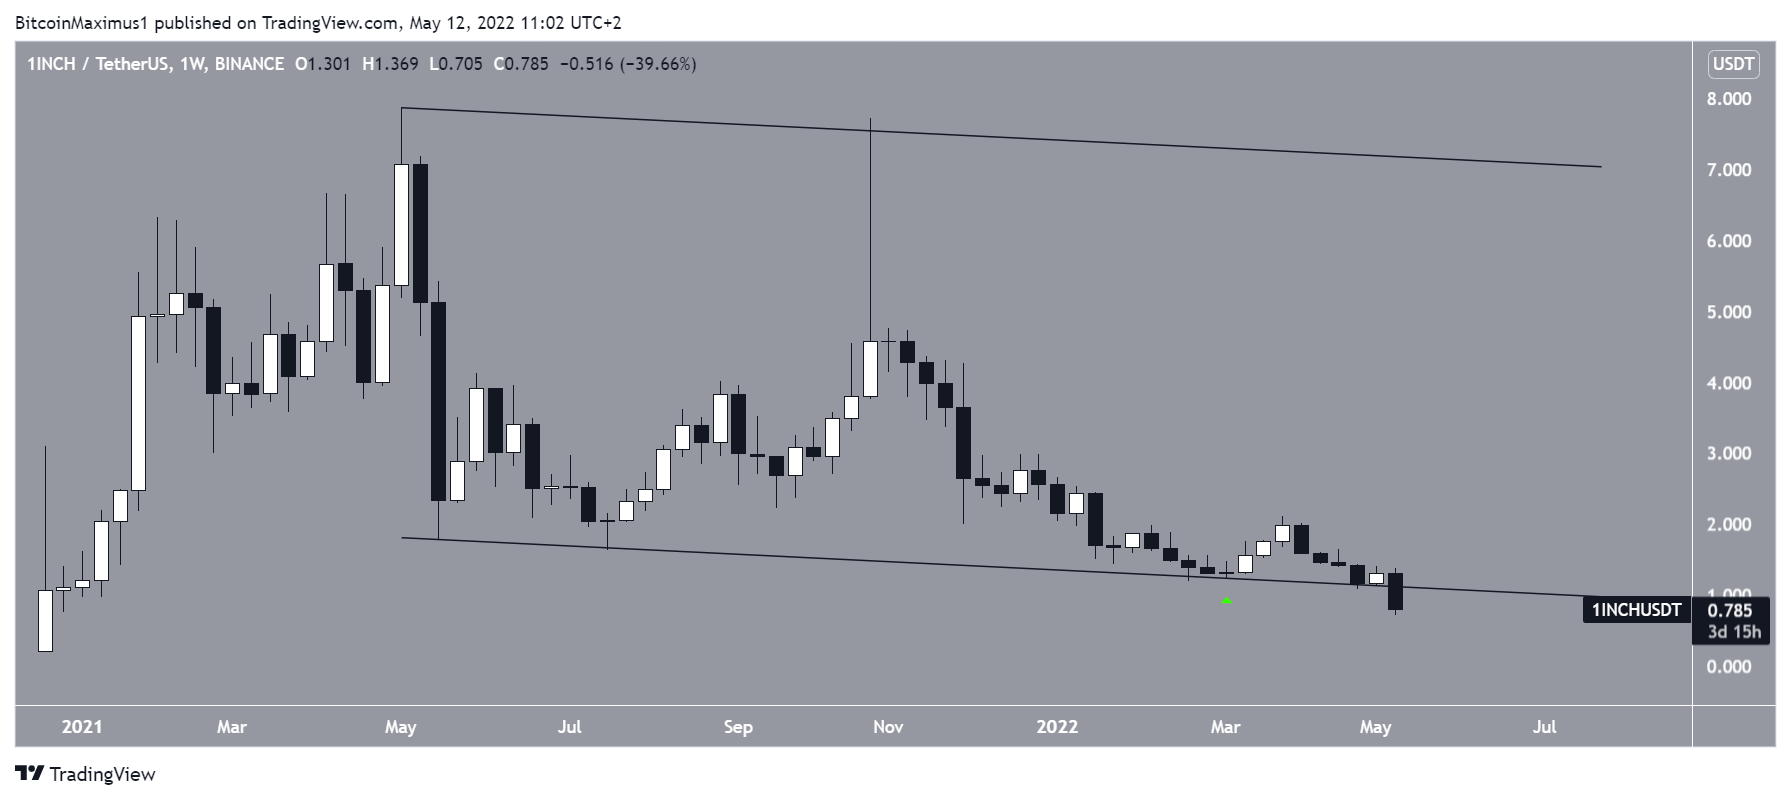
1inch Network (1INCH) has been decreasing inside a descending parallel channel since May 2021. While it bounced at its support line in March (green icon), it failed to initiate a significant upward movement.
1INCH is currently in the process of breaking down from the channel.
AVAX
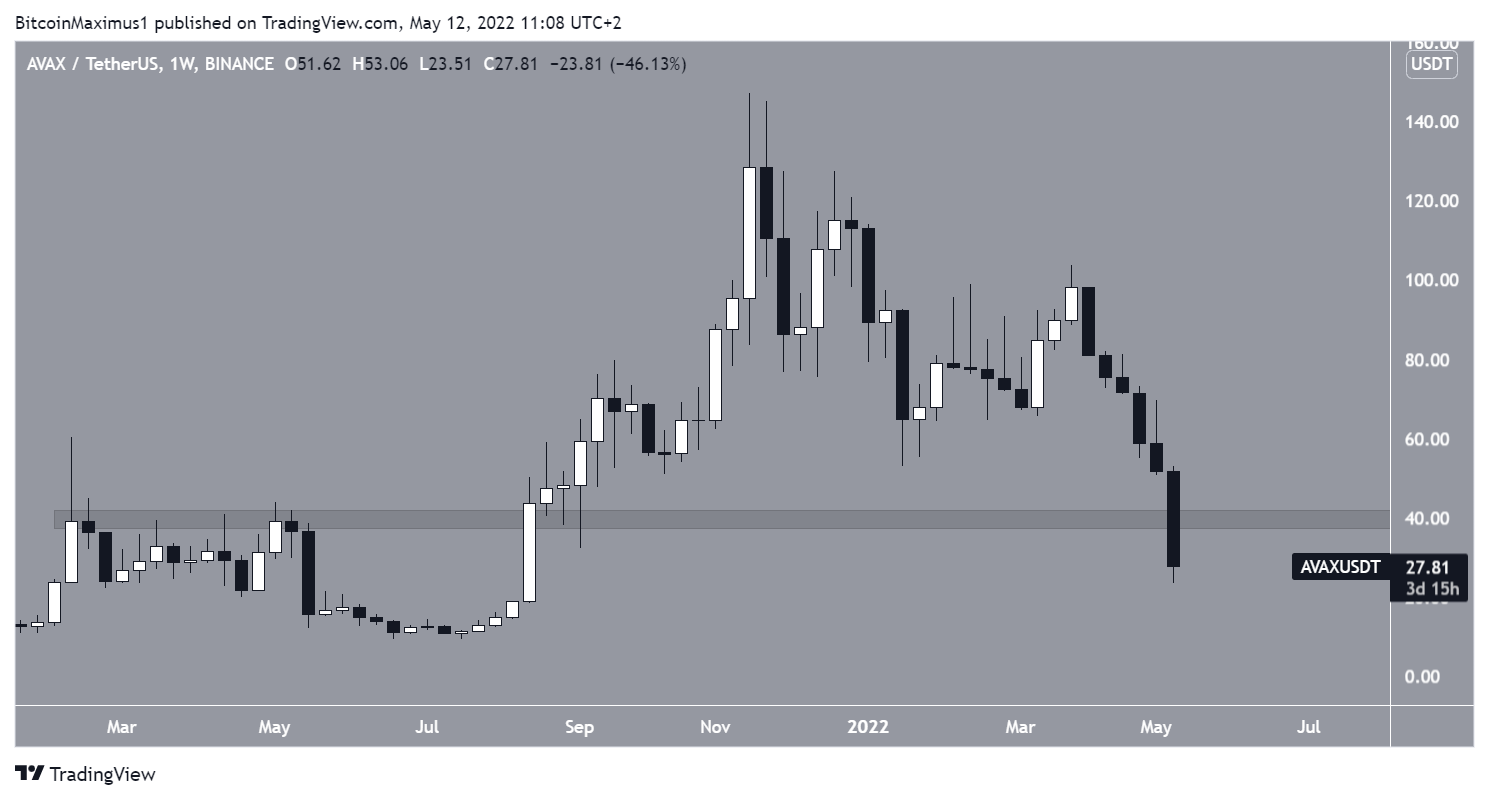
Avalanche (AVAX) has been falling since reaching an all-time high price of $147 in Nov 2021. The downward movement accelerated in the beginning of April and the price has so far reached a low of $23.51 on May 12.
AVAX is currently in the process of breaking down from the $40 horizontal area, which had previously acted as the all-time high resistance and turned to support in Sept 2021.
For Be[in]Crypto’s latest Bitcoin (BTC) analysis, click here