Uma is a blockchain network that allows users to create synthetic assets on the Ethereum blockchain. It is speedy, hack-free, agile, and highly scalable. It has numerous contract templates and aims to decrease costs by minimizing on-chain transactions. UMA is the native token of this ecosystem and the technical analysis is as follows:
Past Performance
On May 5, 2021, UMA started trading at $24.08. On May 11, 2021, UMA closed at $28.98. Thus, in the past week, the UMA price has surged by roughly 20%. In the last 24 hours, UMA has traded between $28.40-$29.45.

https://s3.tradingview.com/snapshots/u/UaYJBbwZ.png
Day-Ahead and Tomorrow
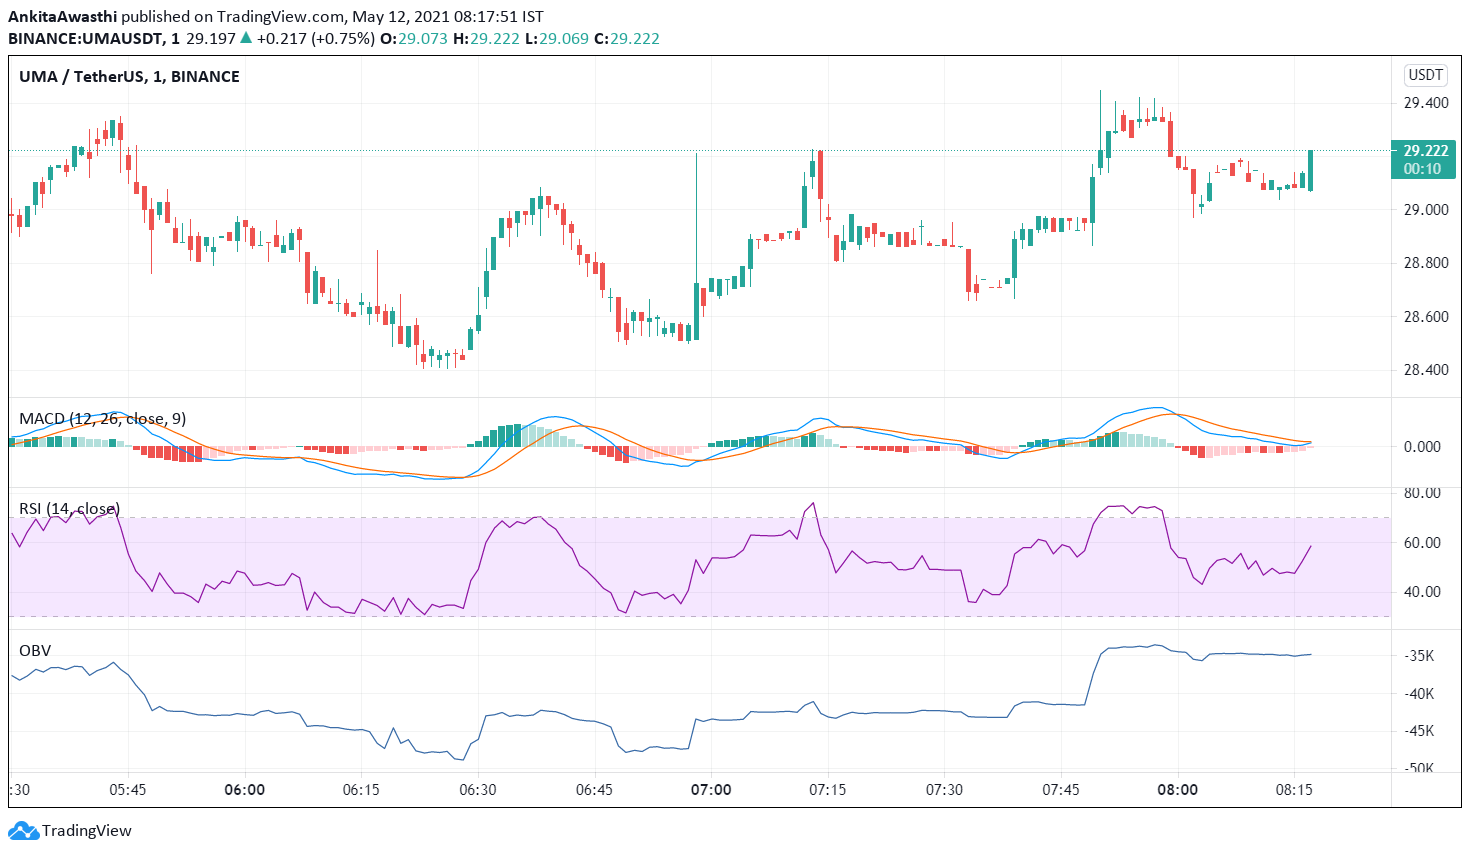
Currently, UMA is trading at $29.22. The price has increased from the day’s opening price of $28.98. Thus, the market seems to be uptick.
The MACD and signal lines are positive. Moreover, a bullish crossover by the MACD line over the signal line has occurred. Thus, the overall market momentum is bullish. However, both the lines are very close to the zero line and may turn negative soon. Hence, a trend reversal may be on the horizon.
Currently, the RSI indicator is at 54%. It faced rejection at 60% and fell to this level. Hence, selling pressures are high. Thus, the RSI indicator is giving further credence to an impending price pullback or bullish trend reversal indicated by the MACD oscillator.
However, the OBV indicator is upward sloping. This means that buying volumes are higher than selling volumes. Heavy demand will push UMA price upwards.
UMA Technical Analysis
In a nutshell, when we look at all indicators together, we can say that a price pullback is on the anvil. However, we have to wait and watch to see if it is an intermittent price correction amidst an overall bullish trend or a trend reversal.
Currently, the price is above the Fibonacci pivot point of $28.94, but may soon fall below it. It may fall below the first support level of $28.54 as well. Thereafter, we have to wait and watch if the price resumes its upward journey.
The price may soon test the 23.6% FIB retracement level of $29.20 and fall below it. However, if the bulls regain strength, we can expect the price to retest and break out of this level for some time. In that case, we can expect the price uptrend to sustain tomorrow as well.
 cryptoknowmics.com