The Polkadot price analysis reveals that the (DOT) market has been on a downtrend over the past few days, with prices falling below the $14.0 mark. Despite this, the DOT market has managed to hold prices above the $13.98 handle, which is providing some support for prices at the moment. The main resistance level for the DOT market is currently at the $15.0 mark, where prices have been struggling to break through over the past few days. Prices are likely to continue to struggle in this area unless there is a major breakthrough in the market.
The overall outlook for the DOT market shows a decline in prices over the past few days, with a potential for further declines in the short term. However, the market does appear to be finding some support at lower levels, which could provide a bounce in prices in the near term.
The digital asset has been trading in a range of $13.98 to $14.48 as the price exchanges hands at the $14.20 mark, a decline of 1.33 percent in the last 24 hours. The market capitalization for DOT/USD stands at $1.51 billion, which is a decline of around 2 percent from the day’s high of $1.54 billion.
DOT/USD 1-day price chart: Bears adamant in pushing DOT prices downwards
The 1-day DOT/USD price chart shows that prices have been on a downtrend over the past few days, with a series of lower highs and lower lows being formed. Prices have struggled to break through the $15.0 resistance level over the past few days, which has resulted in a decline in prices.
The main support level for the market lies at the $13.98 handle, where prices have found some stability over the past few days. Prices are likely to continue to struggle in the short term unless there is a major breakthrough in the market. The 24-hour trading volume for DOT/USD has also been on the decline over the past few days, falling from a high of $4.09 billion to its current level of $3.38 billion. This is a decline of around 17 percent from the day’s high.
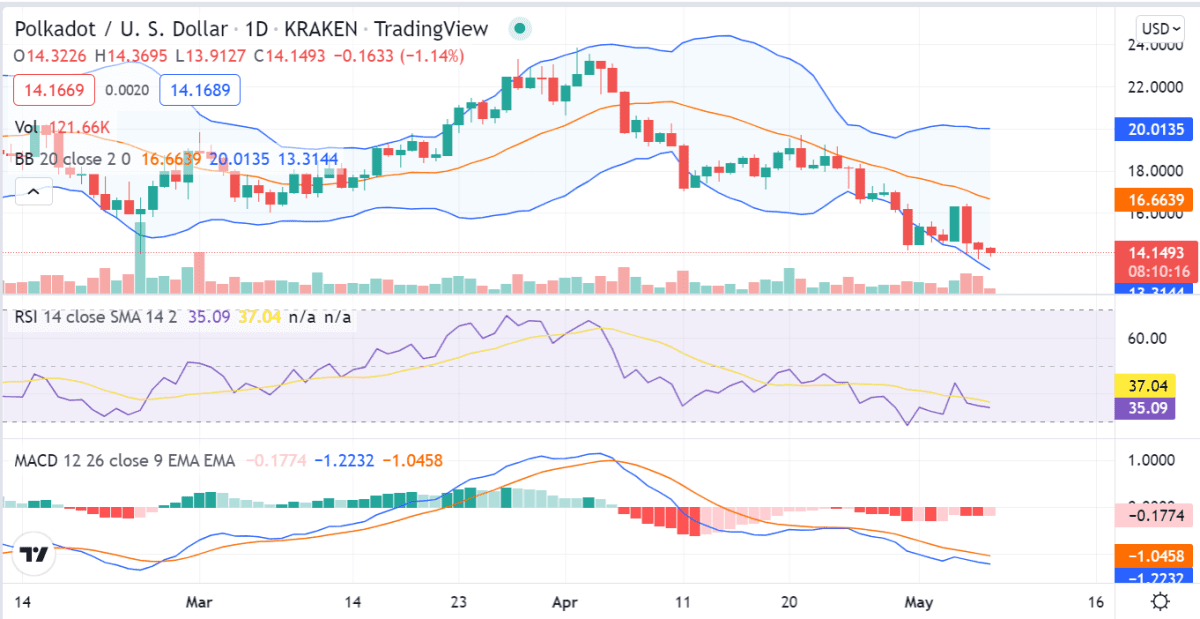
The overall technical picture for DOT/USD shows a bearish market bias in the short term, with prices potentially heading lower towards the $13.98 support level. However, if prices can break through the $15.0 resistance level, then a move higher towards the $16.0 region could be seen. The Bollinger bands are seen to be wide apart on the 1-day DOT/USD chart, indicating high levels of volatility in the market.
The Relative Strength Index (RSI) is currently seen to be at the 42.00 level, which is marginally above the 40.00 level, indicating that prices could potentially move higher in the near term. The MACD indicator is currently showing a bearish trend in the market, with prices potentially heading lower in the short term.
Polkadot price action on a 4-hour price chart: Support seen at the $13.98 level
The 4-hour DOT/USD price chart shows that prices have been on a downtrend over the past few days, with a series of lower highs and lower lows being formed. The technical indicators are currently bearish on the 4-hour chart, with the RSI currently seen at the 42.05 level and the MACD indicator showing a bearish trend in the market. Prices are currently trading around the $14.20 mark, which is a decline of around 1.33 percent from the day’s high of $14.48.
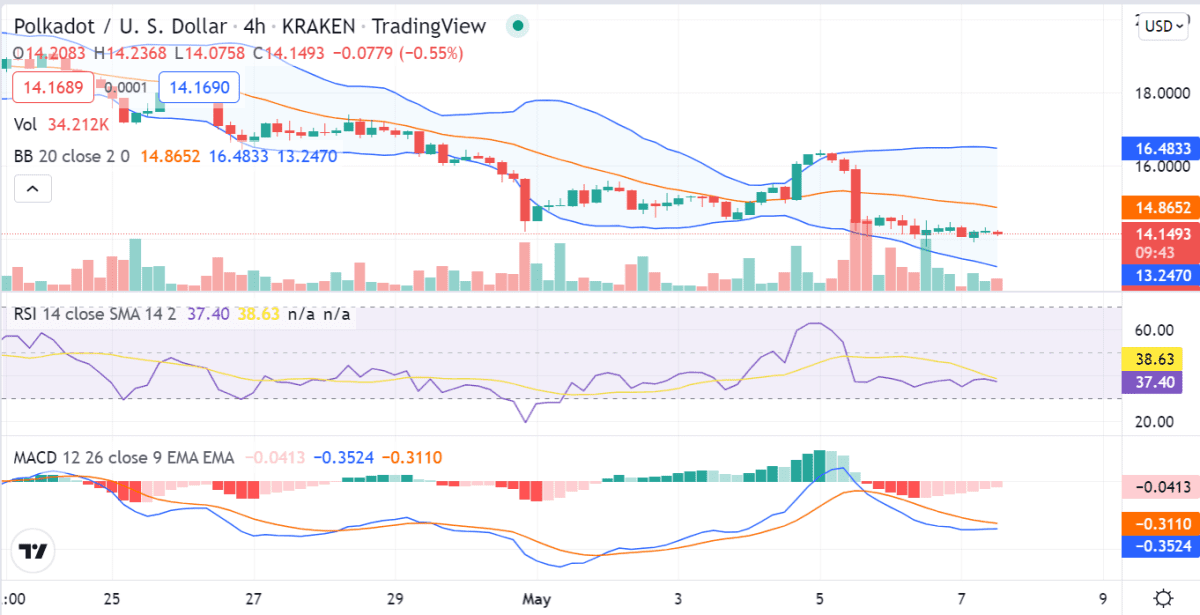
The market volatility is high as indicated by the Bollinger bands which are seen to be wide apart on the 4-hour chart. The main support level for the market lies at the $13.98 handle, where prices have found some stability over the past few days. The prices seem to be in a consolidation phase as of now and a breakout is awaited for the next direction.
Polkadot price analysis conclusion
The overall market sentiment for DOT/USD is currently bearish in the short term, with prices potentially heading lower towards the $13.98 support level. However, if prices can break through the $15.0 resistance level, then a move higher towards the $16.0 region could be seen. The bulls have defended the key support level at $13.98, which could lead to a bounce in prices in the near term.
Disclaimer. The information provided is not trading advice. Cryptopolitan.com holds no liability for any investments made based on the information provided on this page. We strongly recommend independent research and/or consultation with a qualified professional before making any investment decisions.